-
Notifications
You must be signed in to change notification settings - Fork 0
Journal Club Presentation
% Defying the Curse of Dimensionality: Competitive Seizure Prediction with Kaggle % Gavin Gray % November 28th 2014
. . .

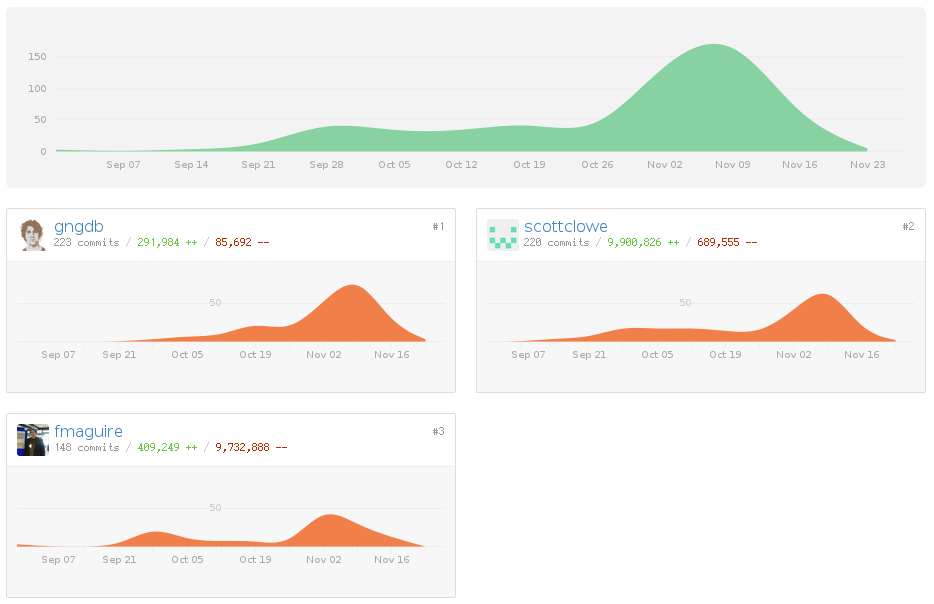
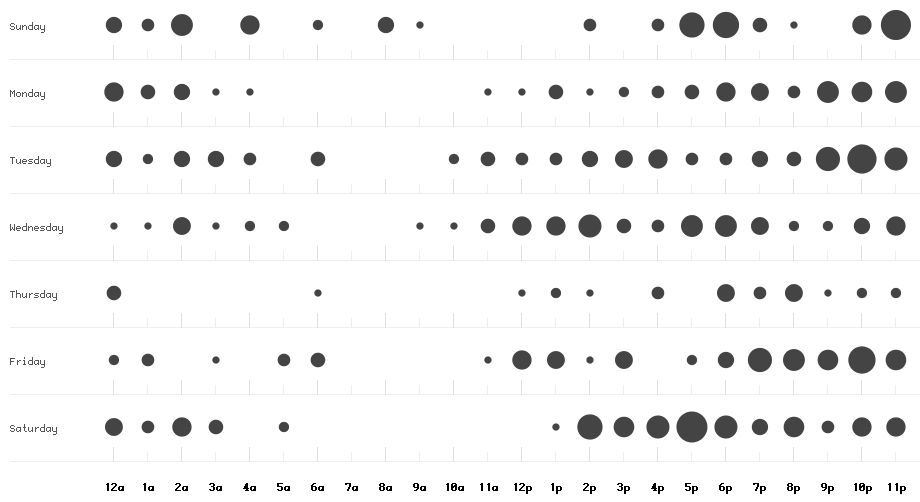
To get an idea of what something is, instead of describing it, what if I just show you what it looks like from some different angles? Then you can get an idea of what it is yourself. These are some ways of looking at the Kaggle competition project Scott, Finlay and I were working on.
This is one of the standard graphs github will produce if you ask it to.

That might say more about us than it does about the project.
![Graph showing example pre-ictal samples from the raw data [@aeskaggle].](images/AESraw.png)

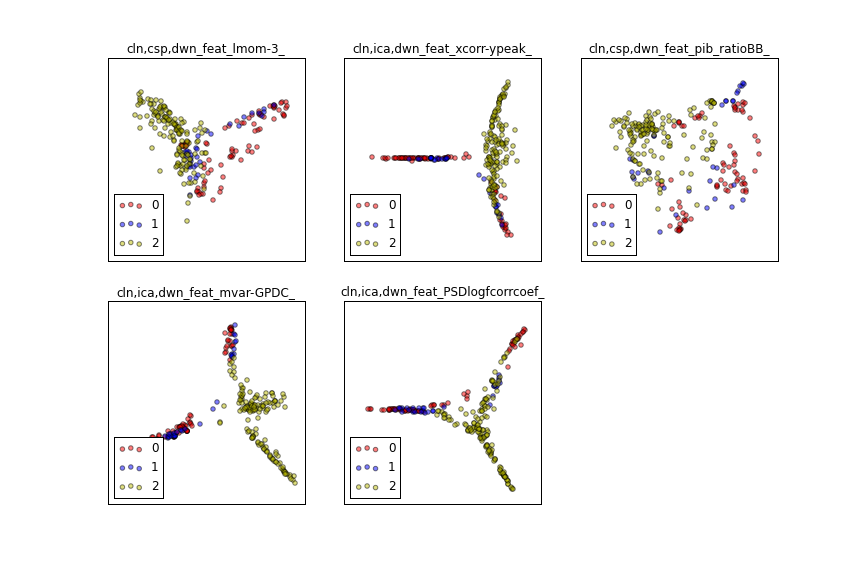
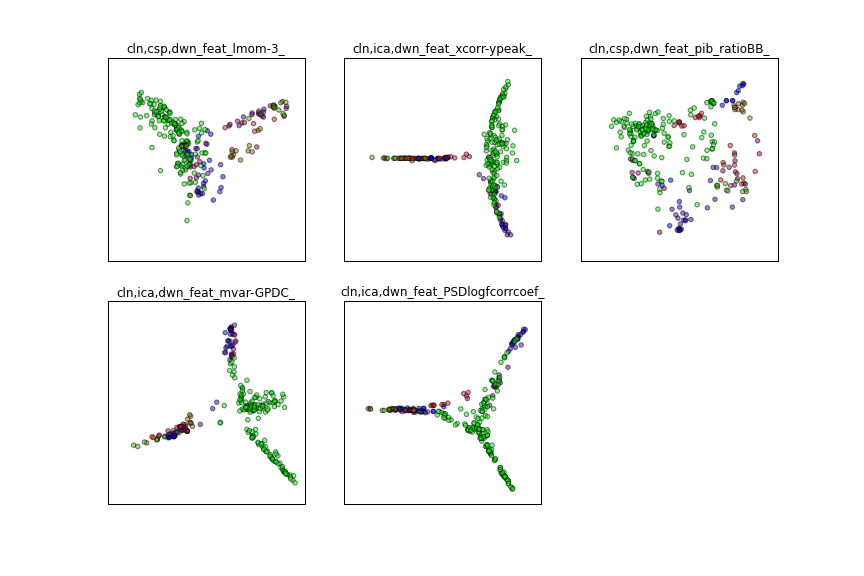
Forms an affinity matrix given by the specified function and applies spectral decomposition to the corresponding graph laplacian. The resulting transformation is given by the value of the eigenvectors for each data point.
This graph illustrates why generalisation in this problem was so difficult. You can see that if our task was to tell the difference between test and training it would be much easier than telling the difference between interictal and preictal.

![Final leaderboard results [@aeskaggle].](images/hsleaderboard.png)
That's the competition.
We were scored on a measure of area under the curve (AUC) on an receiver operating characteristic (ROC) curve. Basically, it's a plot of false positive versus true positive rate as the threshold of the classifier was varied.
We could submit ten entries a day, and receive scores on each. So you might think we could just overfit the test data by submitting a huge number of times. There's a catch, the score on the leaderboard during the competition is only calculated from a fraction of the submission, and at the end the real value using all of the test data is revealed.
This means that at the end of the competition, there's a big shakeup of the scores. It worked pretty well for us, as we went up 15 places.
A sample from 143 completed competitions:
- Heritage Health Prize
- Merck Molecular Activity Challenge
- Observing Dark Worlds
- The Marinexplore and Cornell University Whale Detection Challenge
- Africa Soil Property Prediction Challenge
- CONNECTOMICS (that is the whole name)
- Many, many corporate competitions...
I've tried to pick out a good mix of the different kinds of projects on there, but there's definitely some that are different from those I've picked.
The first one here, the Heritage Health Prize was a competition to predict whether someone would go to hospital based on their previous health problems in the last year. The prize was $500,000 (it's the biggest prize so far awarded).
The Observing Dark Worlds challenge I put there because Iain Murray here at Edinburgh did very well in that one, getting 2nd (narrowly).
The others are a mix. A large proportion of the competitions are corporate analytics: predicting if people will click adds, employee habits etc.
Free to use anything to get the job done. We used:
- Matlab
- Scikit-learn
- Git
- Various other Python packages
- Working with HDF5s
- MongoDB
Here are some of the things we used. We used Matlab for feature preprocessing as the files came in .mat format, which makes them more difficult to open than the documentation for scipy.io says.
It's possible to quickly try things out to see if they'll work.
Comprehensive list of features can be found in the [repository][repo]. Useful extractions were:
-
cln,csp,dwn_feat_pib_ratioBB_:- cln - Cleaned
- csp - Common Spatial Patterns (transformation)
- dwn - Downsampled
- pib - Power in band
- ratioBB - ratio of power to broadband power
-
cln,ica,dwn_feat_mvar-PDC_:- ica - Independent Component Analysis (transformation)
- mvar - coefficients of fitted Multivariate-AutoRegressive model
- PDC - Partial Directed Coherence for MVAR
- And approximately 850 other options...
The first of these in the plots we've already seen. Despite being relatively simple, it was very effective, which is consistent with what other teams found. The other feature here also scored highly in our batch tests, but unfortunately we were never able to accurately reproduce those results on the leaderboard, which was frustrating.
There are many, many more of these options which Scott managed to create, all are sitting on the salmon server if you want to take a closer look, but their descriptions you can find on the wiki for the repository.
Here is a list (incomplete) of what we tried:
- Random Forests
- Random forest classifiers
- Totally random tree embedding
- Extra-tree feature selection
- Support Vector Machines
- Various different kernels
- Logistic Regression
- Adaboost
- Platt scaling
- Univariate feature selection
- Restricted Boltzmann machine
- Recursive feature elimination
- ...
- Teamwork with git experience
- TDD
- Code documentation
Scott mainly worked on the preprocessing in matlab. In the repository there is a vast directory of matlab scripts, which I avoid.
We were also able to put some time into learning development techniques which we wouldn't find a good excuse to look at otherwise. This was largely using unit tests in Python to get some bugs out of the code we were using to build training and test sets from the processed HDF5s.
Once Scott was done with it this resulted in around 300GB of HDF5 files from around 30GB of raw data.
Figuring our which of these were actually going to be useful was a massive problem, considering we only had around 4000 samples spread over 7 subjects.
We launched several batch scripts with the hope that we might be able to find a "silver bullet" feature somewhere in there.
This failed, and it proved extremely difficult to find anything better than our hand-picked set of features we chose at the start of classification, once the preprocessing had been finished.

In a last ditch attempt to improve our score slightly I just took our two best submission csvs and averaged the predictions.
We immediately jumped up 4 places.
Including some other high performing submissions we were able to jump up several more places before the end of the competition.
Michael Hill's method came up on Github two days ago [@hill]:
...population size of 30 and runs for 10 generations. The population is initialised with random feature masks consisting of roughly 55% features activated and the other 45% masked away. The fitness function is simply a CV ROC AUC score.
His model:
. . .
The default selected classifier for submission is linear regression.
Linear regression was the method of choice
a.k.a. Scikit-learn linear regression with the
predict_proba method scaled and sigmoided.
Others with high-scoring results also did this,
including Jonathan Tapson.
Our repository can be found at... TODO
. . .
Advantages:
- Get to try new things
- Learn new skills
- Working break from your PhD - you get immediate feedback
- Might discover something useful
. . .
Disadvantages:
- Can quickly absorb time
- You have to have a good team
- Models people create are not necessarily useful:
- Netflix challenge
- Engineered ensemble models are over-complicated
The next competitions coming up are:
- BCI Challenge @ NER 2015 - $1,000
- Helping Santa's Helpers - $20,000
- Click-Through Rate Prediction - $15,000
The first of these is probably the interesting one. The goal is to detect errors in a spelling task, given EEG recordings.
The second involves optimising an objective function by assigning different elves to different toys. Unfortunately, it's by a company called FICO and they want you to use their special software to do it...
The third you're allowed to use whatever you want, but it's not very interesting. And if you're doing a PhD you probably never wanted to work for an advertising company.
Some text.