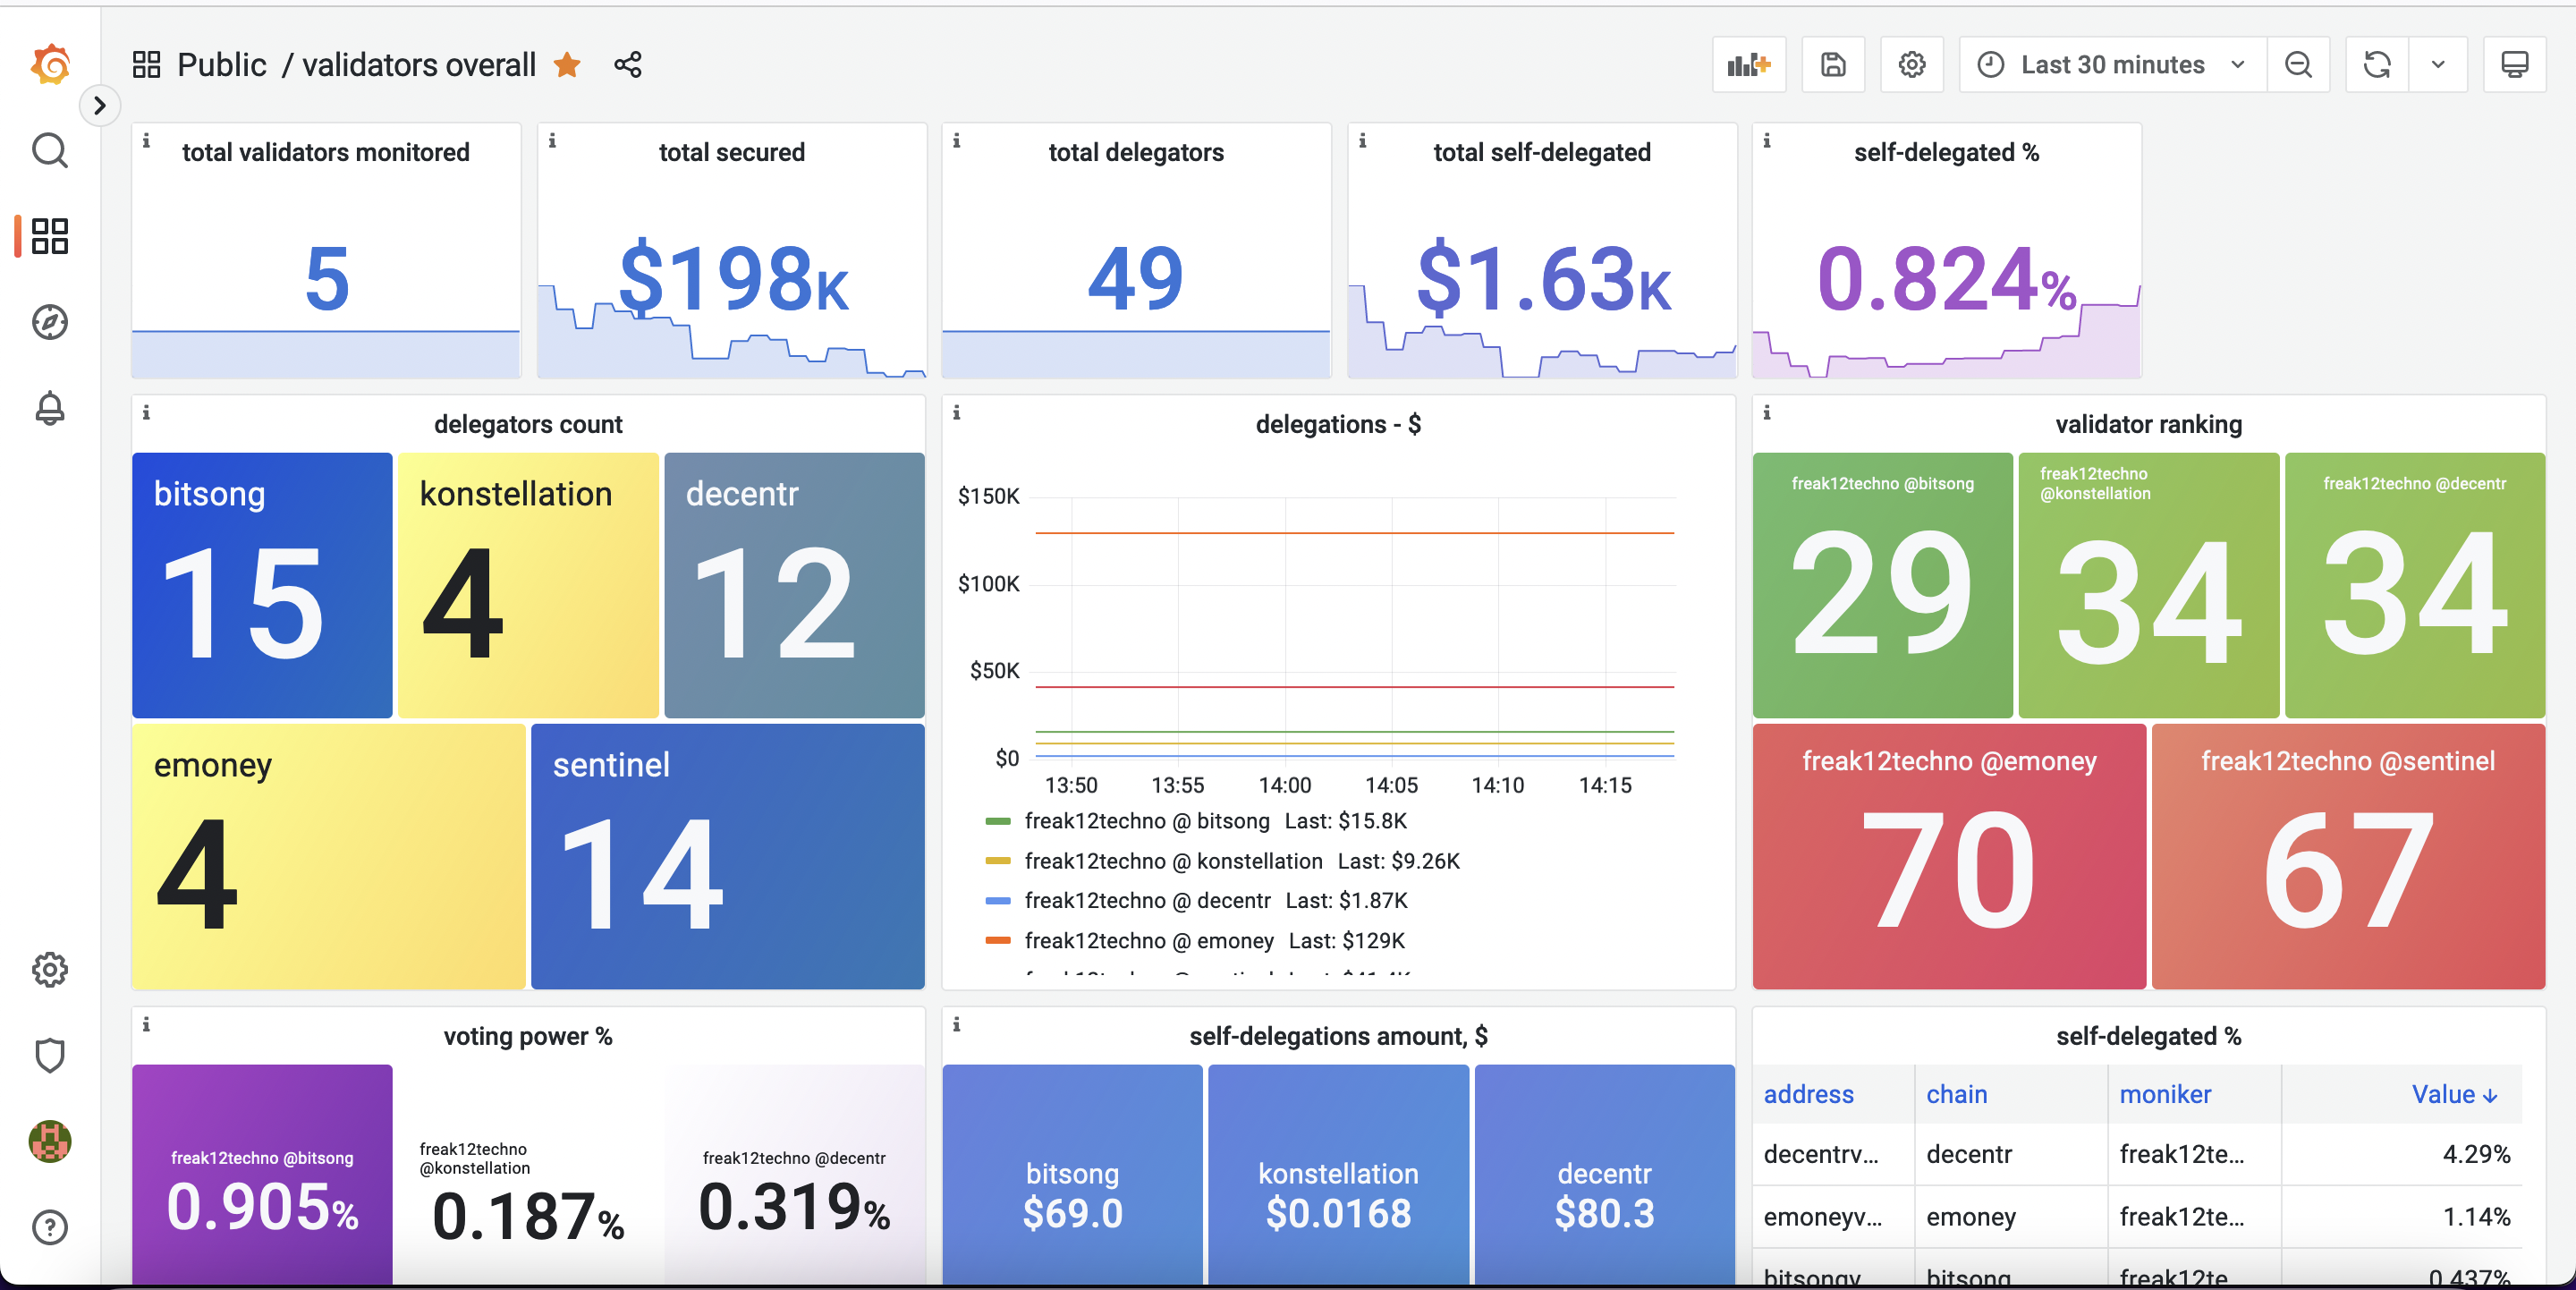
cosmos-validators-exporter is a Prometheus scraper that fetches validators stats from an LCD server exposed by a fullnode.
You can use it for building a validator(s) dashboard(s) to visualize your validators metrics (like total staked amount, delegators count, etc.) as well as building alerts for your validators' metrics (like validator status/ranking/total staked amount/etc.)
Here's an example of the dashboard we're using in production:
First, you need to download the latest release from the releases page. After that, you should unzip it, and you are ready to go:
wget <the link from the releases page>
tar xvfz <filename you just downloaded>
./cosmos-validators-exporter
Alternatively, you can build from source:
git clone https://github.com/QuokkaStake/cosmos-validators-exporter
cd cosmos-validators-exporter
# This will produce a binary at ./cosmos-validators-exporter.
make build
# This will produce a binary at $GOPATH/bin/cosmos-validators-exporter.
make install
To run it detached, you need to run it as a systemd service. First, we have to copy the file to the system apps folder:
sudo cp ./cosmos-validators-exporter /usr/binThen we need to create a systemd service for our app:
sudo nano /etc/systemd/system/cosmos-validators-exporter.serviceYou can use this template (change the user to whatever user you want this to be executed from. It's advised to create a separate user for that instead of running it from root):
[Unit]
Description=Cosmos Validators Exporter
After=network-online.target

[Service]
User=<username>
TimeoutStartSec=0
CPUWeight=95
IOWeight=95
ExecStart=cosmos-validators-exporter --config <path to config>
Restart=always
RestartSec=2
LimitNOFILE=800000
KillSignal=SIGTERM

[Install]
WantedBy=multi-user.target
Then we'll add this service to autostart and run it:
sudo systemctl daemon-reload # reflect the systemd file change
sudo systemctl enable cosmos-validators-exporter # enable the scraper to run on system startup
sudo systemctl start cosmos-validators-exporter # start it
sudo systemctl status cosmos-validators-exporter # validate it's running
If you need to, you can also see the logs of the process:
sudo journalctl -u cosmos-validators-exporter -f --output catHere's the example of the Prometheus config you can use for scraping data:
scrape-configs:
  - job_name:       'cosmos-validators-exporter'
    scrape_interval: 60s
    scrape_timeout: 60s
    static_configs:
      - targets:
        - localhost:9560 # replace localhost with scraper IP if it's on the other host
Then restart Prometheus and you're good to go!
Important: consider setting quite big intervals/timeouts, both in app config and in Prometheus config. This is due to some requests taking a lot of time, and with a shorter timeout there's a chance the whole scrape request will time out. If you face scrape errors, consider increasing the timeout.
All the metrics provided by cosmos-validators-exporter have the cosmos_validators_exporter_ as a prefix.
For the full list of metrics, try running curl localhost:9560/metrics (or your host/port, if it's non-standard)
and see the list of metrics there.
When developing, we aimed to only return metrics that are required, and avoid creating metrics that can be computed on Grafana/Prometheus side. This decreases the amount of time series that this exporter will return, but will make writing queries more complex. Here are some examples of queries that we consider useful:
count(cosmos_validators_exporter_info)- number of validators monitoredsum((cosmos_validators_exporter_total_delegations) * on (chain) group_left(denom) cosmos_validators_exporter_base_denom / on (chain, denom) cosmos_validators_exporter_denom_coefficient * on (chain, denom) cosmos_validators_exporter_price)- total delegated tokens in $sum(cosmos_validators_exporter_delegations_count)- total delegators countcosmos_validators_exporter_total_delegations / on (chain) cosmos_validators_exporter_tokens_bonded_total- voting power percent of your validator1 - (cosmos_validators_exporter_missed_blocks / on (chain) cosmos_validators_exporter_missed_blocks_window)- validator's uptime in %
All configuration is done via the .toml config file, which is passed to the application
via the --config app parameter. Check config.example.toml for a config reference.
Bug reports and feature requests are always welcome! If you want to contribute, feel free to open issues or PRs.

