-
-
Notifications
You must be signed in to change notification settings - Fork 414
New issue
Have a question about this project? Sign up for a free GitHub account to open an issue and contact its maintainers and the community.
By clicking “Sign up for GitHub”, you agree to our terms of service and privacy statement. We’ll occasionally send you account related emails.
Already on GitHub? Sign in to your account
Memory leak? #479
Comments
|
Mind taking a look in your log? You'll find it under File -> Settings -> Logging -> Show SyncTrayzor Log File. You should see lines containing "SyncTrayzor.Services.MemoryUsageLogger" - mind pasting a few of those corresponding to high memory usage in Process Explorer? This looks like it might be similar to #37: this was something to do with the embedded browser component, but we weren't able to narrow down what was causing it. |
Same number for the past 3 days, from the box that I screenshot with. Feel free to give me diagnostic tools against that process if necessary. |
|
Also this code prevents the detailed number from being logged. I checked the log on the one that has 1.5GB usage, showing GC total memory of 1GiB. |
|
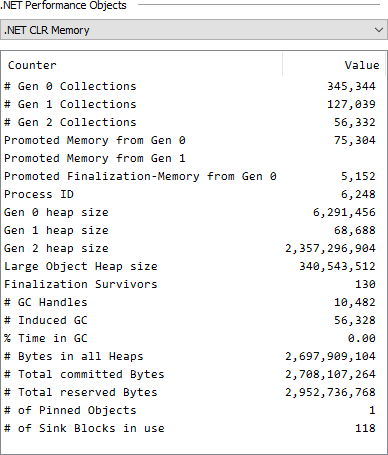
After sacrificing one of the process, I got some debug information for you. |
|
Thanks for the sleuthing! This doesn't look like #37: that was characterised by high working set but low GC Total Memory. This does look like a memory leak somewhere in managed code, you're right. (The following are notes that I made while investigating) So it looks like we're leaking a very large number of very small UnmanagedMemoryStreams (104 bytes each). One place where UnmanagedMemoryStream is used is in Assembly.GetManifestResourceStream, but I'm only calling that explicitly in 2 places, both load things larger than 104 bytes, and both properly dispose it. So it's not that. It looks like FontFamily with a font from an embedded resource can also leak, but the only place I set the FontFamily explicitly is to Consolas, so we shouldn't be hitting that. Attaching a memory profile, it looks like it's held by BitmapImage instances, holding images for the taskbar icon... They end up being kept alive like this: Reading the PackagePart source, it looks like PackagePart holds onto streams until they have been explicitly disposed -- no relying on the finalizer here -- so the thing which originally requested the stream isn't explicitly disposing it. Digging further, the other sort of retention graph for instances is: What's curious is that these BitmapImages should only ever be created once, and then reused. Indeed, looking at the dictionary above, it looks like there's a reference from the ResourceDictionary, as there should be. So it looks like something's recreating the ResourceDictionary...? Although, this looks relevant. Ah. Style's Setter with StaticResource explicitly allows a DeferredResourceStream. You end up here. And that's about where I lose the plot. Ah, taking another tack -- seeing where the StaticResource is passed to -- we end up here. Specifically, here. It turns out that Icon doesn't take ownership of the Stream, so disposing the icon won't dispose that stream. Let's see if that makes a difference... That seems to have worked - there are plenty of instances around, but the number of instances doesn't change over time, whereas it used to... So I think that's it! |
|
I should really get another release out soon, and this will be included. |
|
Unfortunately this only gets obvious after a long period of running. The one that has 2.5G of memory usage has been running for 6 months, and 1.5G's 3 months-ish. Guess we'll have to wait for a few weeks to verify if it actually fixes the issue. But I'm very impressed that you could find the root cause so quick. Good job! |
|
Yeah, I appreciate that. I found and fixed *a* leak at any rate (a memory profiler showed the number of UnmanagedMemorySteams increasing over time without the fix, and not with the fix), and it's the same object type that appeared in your very helpful last post, so I'm hopeful I've fixed it...
…On 16 September 2018 22:42:42 BST, Xinyue Lu ***@***.***> wrote:
Unfortunately this only gets obvious after a long period of running.
The one that has 2.5G of memory usage has been running for 6 months,
and 1.5G's 3 months-ish. Guess we'll have to wait for a few weeks to
verify if it actually fixes the issue. But I'm very impressed that you
could find the root cause so quick. Good job!
--
You are receiving this because you commented.
Reply to this email directly or view it on GitHub:
#479 (comment)
|


Got a few boxes running for long, and I noticed that SyncTrayzor is using a little more than necessary now.
I have restarted the application on most of the nodes, but thought maybe I should leave 1 or 2 for debugging purpose. Most of them use 1.5-2.5GB private working set, and the sole purpose of syncthing is to sync some datasets between them.
The text was updated successfully, but these errors were encountered: