Reduce number of jump-stubs on ARM64 via smaller preserved space #63842
Conversation
|
There is a similar calculation for Windows here: runtime/src/coreclr/utilcode/executableallocator.cpp Lines 54 to 98 in 23de817 |
| #else | ||
| // Smaller values for ARM64 where relative calls/jumps only work within 128MB | ||
| static const int32_t CoreClrLibrarySize = 32 * 1024 * 1024; | ||
| static const int32_t MaxExecutableMemorySize = 0x7FF0000; // 128MB - 64KB |
There was a problem hiding this comment.
How much of this range gets consumed in a real-world ASP.NET app?
Note that we map all sorts of stuff into this range, including R2R images. I would expect that 128MB gets exhausted fairly quickly given how things work today.
I agree that this fix works well for micro-benchmarks that are very unlikely to exhaust the 128MB range.
There was a problem hiding this comment.
Will try to investigate, I guess the idea that the hot code (tier1) should better be closer to VM's FCalls by default?
For large apps I guess we still want to try to address your suggestion with emitting direct addresses without jump-stubs in tier1 #62302 (I have a draft)
For R2R-only it can be improved by pgo + method sorting?
There was a problem hiding this comment.
I do not think R2R code today benefits from being close to coreclr as all 'external' calls/branches have to go through indirection cells anyway. This may have been different in the days of fragile ngen?
Please correct me if I'm wrong @jkotas.
There was a problem hiding this comment.
For large apps I guess we still want to try to address your suggestion with emitting direct addresses without jump-stubs
I do not think it is just for large apps. With TC enabled, all managed->managed method calls go through a precode that has the exact same instructions as jump stub and so it will introduce similar bottleneck as what you have identified.
For R2R-only it can be improved by pgo + method sorting?
R2R images are generally smaller than 128MB. You can only sort within the image, so the sorting won't help with jump stubs. (Sorting within image is still good for locality.)
Also, once we get this all fixed, we may want to look at retuning the inliner. My feeling is that the inliner expands the code too much these days. Some of it may be just compensating for the extra method call overhead that we are paying today.
There was a problem hiding this comment.
I do not think R2R code today benefits from being close to coreclr as all 'external' calls/branches have to go through indirection cells anyway.
Calls from runtime generated stubs and JITed code to R2R code still benefit from the two being close.
There was a problem hiding this comment.
JITed code to R2R code
Do these not go through an indirection when tiering is enabled?
There was a problem hiding this comment.
Do these not go through an indirection when tiering is enabled?
Yes - when tiering is enabled. No - when tiering is disabled.
There was a problem hiding this comment.
With TC enabled, all managed->managed method calls go through a precode that has the exact same instructions as jump stub and so it will introduce similar bottleneck as what you have identified.
I'll start from your suggestion to emit direct calls for T1 Caller calls T1 Callee (not as part of this PR)
|
Allocations seem also a bit faster: [Benchmark]
public object Alloc() => new object(); |
|
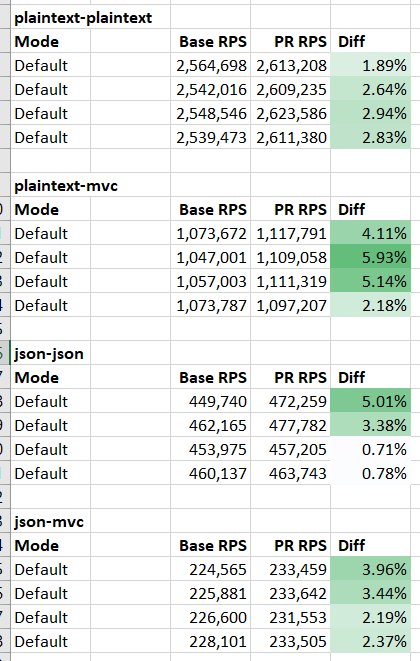
Techempower: PS: |

|
Hm.. even with this change I still see jump-stubs in Plaintex-Plaintex-default (precode fixup are selected just to highlight the other problem) Plaintext-MVC: but it feels like it's not the actual jump-stub but a function that creates them 😐 |


| SIZE_T reach = 0x7FFF0000u; | ||
| #else | ||
| // Smaller size for ARM64 where relative calls/jumps only work within 128MB | ||
| SIZE_T reach = 0x7FF0000u; |
There was a problem hiding this comment.
This may collide with other ASLR assigned addresses and lead to non-trivial private working set hits for native .dlls or R2R images that are loaded after coreclr is initialized.
We try to start as far as possible from coreclr base address to avoid that situation on x64. Look for the comment below: "We try to occupy the space as far as possible to minimize collisions with other ASLR assigned addresses."
There was a problem hiding this comment.
Are you saying that win-arm64 is fine as is?
I am still trying to understand the problem. E.g. we reserve 2GB via, I assume, VirtualAlloc
how come we end up with a large distance between coreclr code and jitted code in memory even for a hello-world
There was a problem hiding this comment.
Just checked - win-arm64 app emits less jump-stubs for a completely empty app: only 4 (two inside StelemRef and two inside IndexOf)
There was a problem hiding this comment.
Are you saying that win-arm64 is fine as is?
I am saying that this change is potentially replacing one performance problem with a different performance problem on win-arm64.
All modern OSes have address space layout randomization. Our attempts to allocate near coreclr library are going against that. So we have to be careful not to be on collision course with what the OSes are trying to do.
win-arm64 app emits less jump-stubs for a completely empty app
Before this change, or only with this change?
There was a problem hiding this comment.
Before this change, or only with this change?
Before (Main)
There was a problem hiding this comment.
Do you understand why it is the case? The executable space should be typically allocated more than 128MB away from coreclr.dll on win-arm64 if I am reading this code correctly.
There was a problem hiding this comment.
@jkotas oops, nvm, I forgot that on M1 I used DOTNET_ReadyToRun=0. I've just tried it with R2R=0 on win-arm64 and got exactly the same list of methods requesting jump stubs as in #62302 (comment)
|
@jkotas so I don't see how this could land then since it's going to hurt pretty much any code larger than 128mb due to next heap being randomly far from the first one. Should I at least make this constant configurable or just close this PR? |
|
Agree. I think it is unlikely that a simple one-line fix like what is proposed here is going to work well. It was a good discussion. We can continue in the other PR that you have opened. |
In #62302 (comment) I realized that all internal calls use jump-stubs (double calls basically) because managed code can't reach them within 128MB distance in memory.
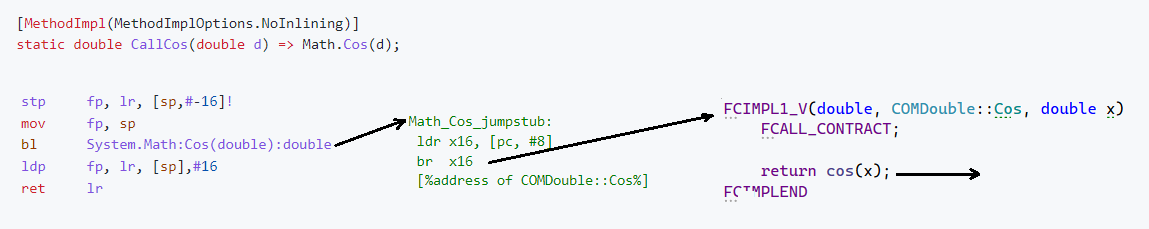
Even an empty console app emits 35 jump stubs. During investigation, @jakobbotsch suggested to change these limits and it helped! Many micro and macro benchmarks significantly improved:
Results on Apple M1 arm64:
Techempower (linux-arm64):
cc @jkotas @jakobbotsch