Version 2.1.3, synced to MPAndroidChart #62f192e
- Xcode 6.3 / Swift 1.2 (Swift 2.0 for Xcode 7 beta is available currently on the
swift-2.0branch) - iOS 7.0 (Drag .swift files to your project)
- iOS 8.0 (Use as an Embedded Framework)
Okay so there's this beautiful library called MPAndroidChart by Philipp Jahoda which has become very popular amongst Android developers, and in the meanwhile there's no decent charting solution for iOS.
I've chosen to write it in Swift as it can be highly optimized by the compiler, and can be used in both Swift and ObjC project. The demo project is written in ObjC to demonstrate how it works.
An amazing feature of this library now, both Android and iOS, is the time it saves you when developing for both platforms, as the learning curve is singleton- it happens only once, and the code stays very similar so developers don't have to go around and re-invent the app to produce the same output with a different library. (And that's not even considering the fact that there's not really another good choice out there currently...)
In order to correctly compile:
- Drag the
Charts.xcodeprojto your project - Go to your target's settings, hit the "+" under the "Embedded Binaries" section, and select the Charts.framework
- Temporary workaround: Xcode 6.3.1 has a bug, where you have to build your project once before actually writing the
@importline. So hit "Build" now! @import Charts- When using Swift in an ObjC project:
- You need to import your Bridging Header. Usually it is "YourProject-Swift.h", so in ChartsDemo it's "ChartsDemo-Swift.h". Do not try to actually include "ChartsDemo-Swift.h" in your project :-)
- Under "Build Options", mark "Embedded Content Contains Swift Code"
If you want to compile for iOS 7:
- Drag the code itself (.swift files) to your project. As sadly, Swift currently does not support compiling Frameworks for iOS 7.
- Make sure that the files are added to the Target membership.
If you like what you see here, and want to support the work being done in this repository, you could:
- Contribute code, issues and pull requests
- Let people know this library exists (spread the word!)

Note: The author of MPAndroidChart is the reason that this library exists, and is accepting donations on his page. He deserves them!
If you are having questions or problems, you should:
- Make sure you are using the latest version of the library. Check the release-section.
- Study the Documentation-Wiki
- Search or open questions on stackoverflow with the
ios-chartstag - Search known issues for your problem (open and closed)
- Create new issues (please search known issues before, do not create duplicate issues)
Core features:
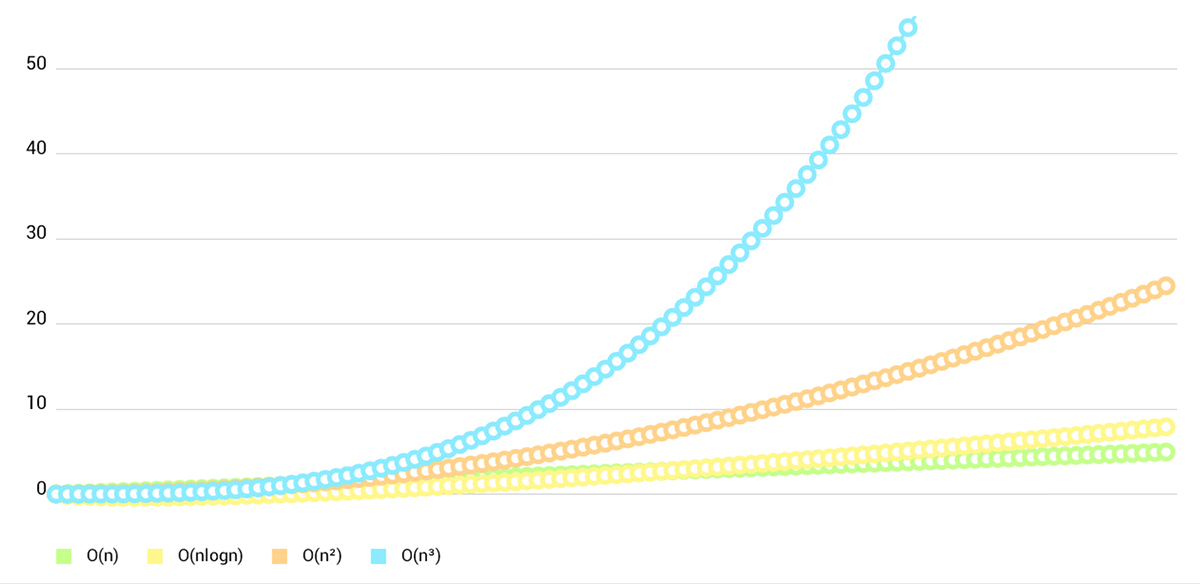
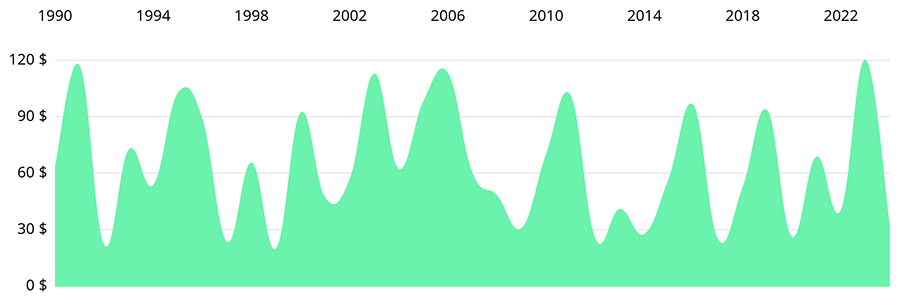
- 8 different chart types
- Scaling on both axes (with touch-gesture, axes separately or pinch-zoom)
- Dragging / Panning (with touch-gesture)
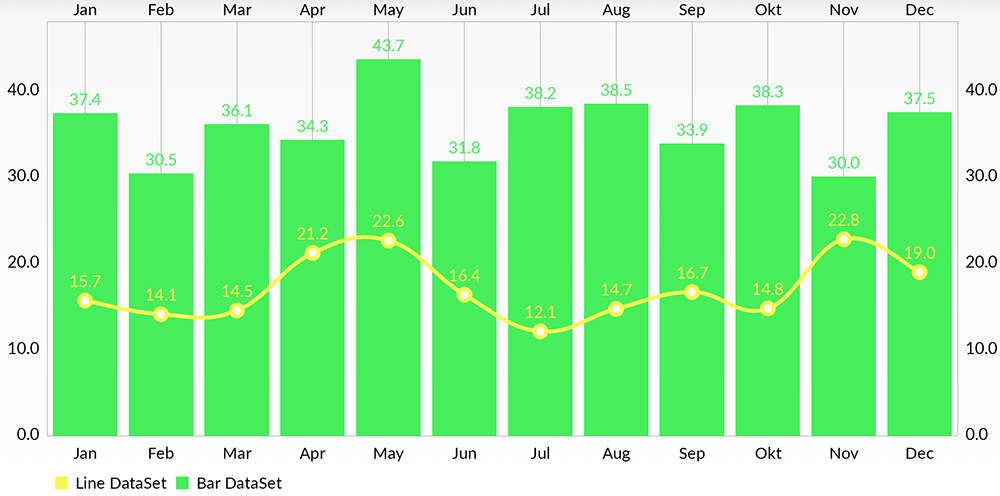
- Combined-Charts (line-, bar-, scatter-, candle-stick-, bubble-)
- Dual (separate) Y-Axis
- Finger drawing (draw values into the chart with touch-gesture)
- Highlighting values (with customizeable popup-views)
- Multiple / Separate Axes
- Save chart to camera-roll / export to PNG/JPEG
- Predefined color templates
- Legends (generated automatically, customizeable)
- Customizeable Axes (both x- and y-axis)
- Animations (build up animations, on both x- and y-axis)
- Limit lines (providing additional information, maximums, ...)
- Fully customizeable (paints, typefaces, legends, colors, background, gestures, dashed lines, ...)
Chart types:
Screenshots are currently taken from the original repository, as they render exactly the same :-)
-
BarChart (with legend, simple design)
- BarChart (grouped DataSets)
- Horizontal-BarChart
- PieChart (with selection, ...)
- ScatterChart (with squares, triangles, circles, ... and more)
- CandleStickChart (for financial data)
- BubbleChart (area covered by bubbles indicates the value)
- RadarChart (spider web chart)
Currently there's no need for documentation for the iOS version, as the API is 95% the same as on Android.
You can read the official MPAndroidChart documentation here: Wiki
Or you can see the ChartsDemo project and learn the how-tos from it.
Goes to @petester42 (Pierre-Marc Airoldi) for implementing a Bubble chart!
To @AlBirdie for his contributions and his involvement in our small community!
And of course thanks to all of those contibuting small fixes here and there! You are all appreciated!
Copyright 2015 Daniel Cohen Gindi & Philipp Jahoda
Licensed under the Apache License, Version 2.0 (the "License"); you may not use this file except in compliance with the License. You may obtain a copy of the License at
http://www.apache.org/licenses/LICENSE-2.0
Unless required by applicable law or agreed to in writing, software distributed under the License is distributed on an "AS IS" BASIS, WITHOUT WARRANTIES OR CONDITIONS OF ANY KIND, either express or implied. See the License for the specific language governing permissions and limitations under the License.


