Skip to content
New issue

Have a question about this project? Sign up for a free GitHub account to open an issue and contact its maintainers and the community.

By clicking “Sign up for GitHub”, you agree to our terms of service and privacy statement. We’ll occasionally send you account related emails.

Already on GitHub? Sign in to your account

Add tickson: 'boundaries' for category cartesian axes #3275

Merged
merged 10 commits into from
Nov 29, 2018
Binary file modified test/image/baselines/tickson_boundaries.png
Loading
Sorry, something went wrong. Reload?
Sorry, we cannot display this file.
Sorry, this file is invalid so it cannot be displayed.
42 changes: 40 additions & 2 deletions test/image/mocks/tickson_boundaries.json
Original file line number Diff line number Diff line change
Expand Up @@ -15,6 +15,7 @@
"x": ["day 1", "day 1", "day 1", "day 1", "day 1", "day 1", "day 2", "day 2", "day 2", "day 2", "day 2", "day 2"],
"y": [0.6, 0.7, 0.3, 0.6, 0, 0.5, 0.7, 0.9, 0.5, 0.8, 0.7, 0.2]
},

{
"type": "bar",
"x": [1, 2, 1],
Expand All @@ -38,12 +39,31 @@
"orientation": "h",
"xaxis": "x2",
"yaxis": "y2"
},

{
"type": "bar",
"name": "with dtick !== 1",
"x": ["a", "b", "c", "d", "e", "f", "g", "h"],
"y": [1, 2, 1, 2, 1, 3, 4, 1],
"xaxis": "x3",
"yaxis": "y3"
},

{
"mode": "markers",
"marker": {"symbol": "square"},
"name": "with overlapping tick labels",
"x": ["A very long title", "short", "Another very long title"],
"y": [1, 4, 2],
"xaxis": "x4",
"yaxis": "y4"
Copy link
Collaborator

Choose a reason for hiding this comment

The reason will be displayed to describe this comment to others. Learn more.

Nice, just squeaks in unrotated if we draw this without
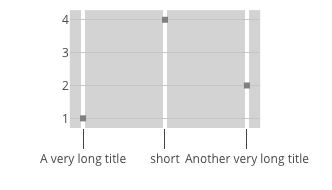
 tickson: 'boundaries' 🎉
screen shot 2018-11-26 at 1 20 37 pm

}
],
"layout": {
"boxmode": "group",
"grid": {
"rows": 2,
"rows": 4,
"columns": 1,
"pattern": "independent",
"ygap": 0.2
Expand All @@ -60,7 +80,25 @@
"gridcolor": "white",
"gridwidth": 4
},
"xaxis3": {
"ticks": "inside",
"tickson": "boundaries",
"gridcolor": "white",
"gridwidth": 4,
"dtick": 2
},
"xaxis4": {
"domain": [0.22, 0.78],
"ticks": "outside",
"ticklen": 20,
"tickson": "boundaries",
"gridcolor": "white",
"gridwidth": 4
},
"plot_bgcolor": "lightgrey",
"showlegend": false
"showlegend": false,
"width": 500,
"height": 800,
"margin": {"b": 140}
}
}