Manipulation :: Algorithms
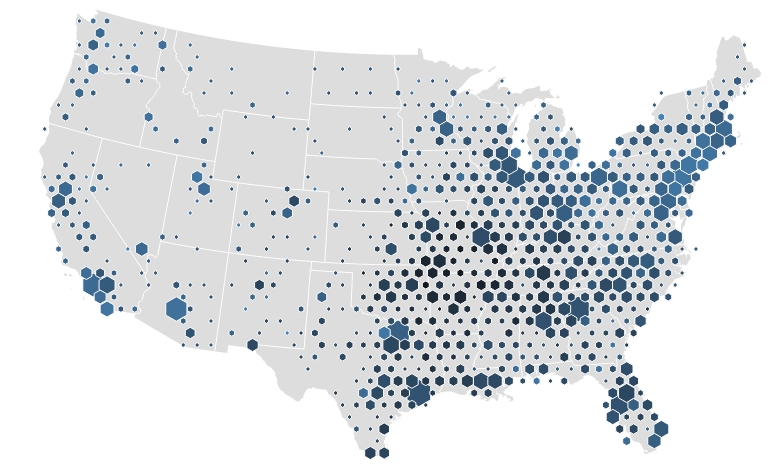
When working on a large dataset, scatterplots might become difficult to read, especially if you are looking for concentrations (densities) to judge the relationship and you have many observations that have the same or very similar values (overplotted points). Binning is a way to group points on the plot in a way that makes it easier to spot patterns.
Hexagonal Binning – a new method of visualization for data analysis
Hierarchical Edge Bundles: Visualization of Adjacency Relations in Hierarchical Data (pdf, academic paper)
In mathematics, a Voronoi diagram is a partitioning of a plane into regions based on distance to points in a specific subset of the plane. That set of points (called seeds, sites, or generators) is specified beforehand, and for each seed there is a corresponding region consisting of all points closer to that seed than to any other. These regions are called Voronoi cells. Wikipedia
Voronoi Diagrams and a Day at the Beach
In mathematics and computational geometry, a Delaunay triangulation for a set P of points in a plane is a triangulation DT(P) such that no point in P is inside the circumcircle of any triangle in DT(P). Delaunay triangulations maximize the minimum angle of all the angles of the triangles in the triangulation; they tend to avoid skinny triangles. The triangulation is named after Boris Delaunay for his work on this topic from 1934. [Wikipedia] (https://en.wikipedia.org/wiki/Delaunay_triangulation)