Adding scalebar: Error in .pointsToMatrix(p1) : longitude < -360 #68
Comments
|
Hello, Apart from that, the distance that should be displayed by the scale bar can be set in km using the |
|
Hello,
|
|
Thanks for the info. Could you provide me with a sample of your data set with which I can reproduce the error? Otherwise it is difficult to track it down. |
|
GPS.xlsx |
|
Hi, |
|
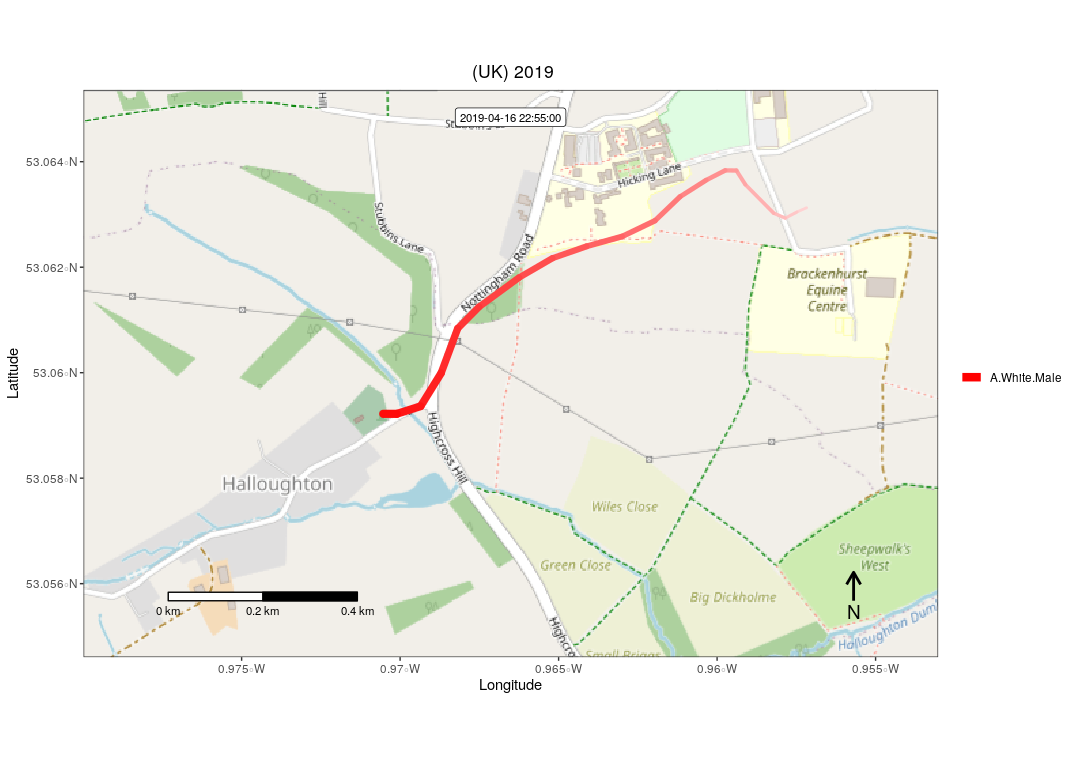
Hi, sorry, I lost track of this issue. This should be fixed by now. Originally, add_scalebar had issues with projections other than unprojected lat/lon. Your code works for me with the latest version: library(moveVis)
gps <- xlsx::read.xlsx("GPS.xlsx", sheetIndex = 1)[1:58,1:6]
gps$dt <- as.POSIXct(gps$dt, format = "%d/%m/%Y %H:%M:%S")
GPS <- df2move(gps, proj = "+init=epsg:4326 +proj=longlat +datum=WGS84 +no_defs +ellps=WGS84 +towgs84=0,0,0",
x = "Longitude" , y = "Latitude", time = "dt", track_id = "ID")
unique(timestamps(GPS))
timeLag(GPS, unit = "mins")
move_data <- align_move(GPS, res = 240, digit = 0, unit = "secs")
move_data <- sp::spTransform(move_data, crs("+init=epsg:3857"))
frames <- frames_spatial(move_data, path_colours = c("red"),
map_service = "osm", path_legend_title = NULL, map_type = "streets", map_res = 0.8, equidistant = F)
frames <- add_labels(frames, title = " (UK) 2019",
x = "Longitude", y = "Latitude") %>%
add_progress() %>%
add_scalebar() %>%
add_northarrow() %>%
add_timestamps(move_data, type = "label")
|
Hello,
I am having some issues when trying to add the scale bar to the frame. If I don't add any scale bar, then everything works fine and I get the frames and video. This is the error I get:
Error in .pointsToMatrix(p1) : longitude < -360
My study area is small, so the scale bar should be lower than 1 km, so I am guessing it has to do with that. Is there any way to work around it.
This is my code. Thanks for your help.
GPS<-df2move(GPS, proj = "+init=epsg:4326 +proj=longlat +datum=WGS84 +no_defs +ellps=WGS84 +towgs84=0,0,0",
x = "Longitude" , y = "Latitude", time = "dt", track_id = "ID")
unique(timestamps(GPS))
timeLag(GPS, unit = "mins")
move_data <- align_move(GPS, res = 240, digit = 0, unit = "secs")
move_data <- sp::spTransform(move_data, crs("+init=epsg:3857"))
frames <- frames_spatial(move_data, path_colours = c("red"),
map_service = "osm",path_legend_title = NULL, map_type = "streets", map_res = 0.8, equidistant = F)
frames <- add_labels(frames, title = " (UK) 2019",
x = "Longitude", y = "Latitude") %>%
add_progress() %>%
add_scalebar() %>%
add_northarrow() %>%
add_timestamps(move_data, type = "label")
The text was updated successfully, but these errors were encountered: