In this workshop we are going to expand what we profiled earlier to all the different areas of the JVM. The JFR has an extensive amount of data which it captures, we will not dive into each of these areas, but hit on a couple more common areas to inspect on your code base.
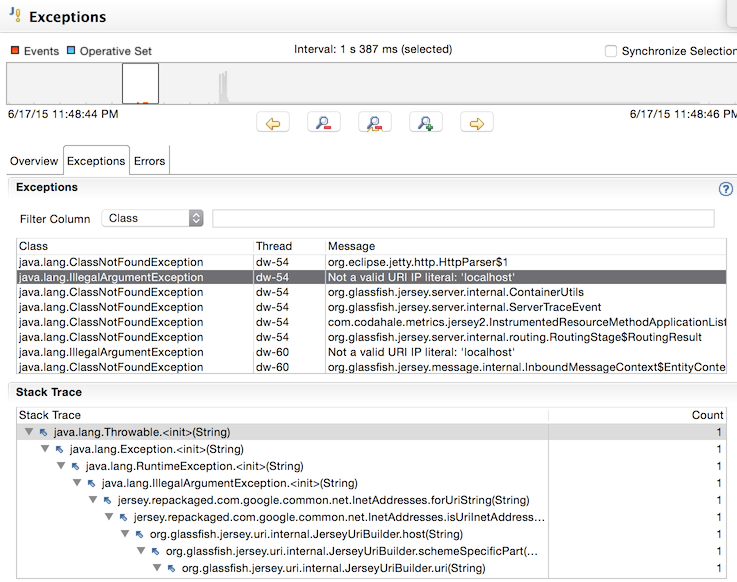
Go into the Code tab, and then navigate to the Exceptions sub tab. Here you can get context of what exceptions are thrown, and when. Exceptions are not necessarily a cheap operation, as there are costs in producing the stack trace.
Within this view, there are three sub tabs:
- Overview: Get counts on exceptions/errors and related stack traces
- Exceptions: Get individual instances of exceptions thrown based on the timeline. Includes string messages which may provide additional context.
- Errors: Same content as the Exceptions view, but for Errors.
Overview:
Exceptions sub view (filtered down to a specific time interval):
- What are the exceptions that are getting generated the most?
- What stack traces are the contributor?
- Select different intervals of time to filter the listing of what is being presented. Can you see where
In the Threads tab, you can get context to compute and latency events tied to threads. For this we will look a couple of things:
- Hot Threads
- Latencies
The Hot Thread sub tab view, you can view threads and the related methods that are consuming the most time. As with other views, you can zoom in on spikes of events to see if there is a common effect. Many times this gives you a better context of related resources (by threads of the same pool) that could be getting heavily utilized by a request. This also helps in correlating other facts you may have (like native threads / thread dumps).
The Latencies sub tab can help show common areas of your code (organized by thread states) which can cause slowness in your code base that may not be directly tied to a heavy computation task (ex. waiting on a network call). Generally it helps to look at the large contributor (based on total time consumed) and see when and why it is getting invoked (and if that can be minimized).
- Where are we spending most of our time sleeping? What is causing this?
The I/O tab, can provide context of what external resources you are utilizing from you code base, and relate it to other latency events. For the purpose of our workshop service, we are doing network I/O, and therefore will look at the Socket Read sub view. From this view you can gain context of what host you are calling, how many times you are calling it, and how much time it is taking.
- What remote services are we interacting with?
- How long are we interacting with them and how many invocations?
- How many times did we make calls and what threads were tied to those calls?


