Some bugs will only appear when the application is deployed in Azure like a typo in a connection string. How do you troubleshoot and fix these issues? In this section, you'll attach the Visual Studio 2017 bebugger to the process running in Azure. It is VERY IMPORTANT that you insist that this should not be done on apps in production since it will block the execution thread.
You'll use the Kudu tools and the App Service Editor (Monaco) to edit files directly in production. Let's say you're visiting uncle Bob, it's 11PM, the site is down and you don't have your laptop. What do you do to fix the issue? Again, it is VERY IMPORTANT that you state that this is against best practices since the changes made outside of the normal source control and deployment process.
How to configure remote debugging for Web Apps & Visual Studio 2017 https://www.youtube.com/watch?v=2-Dt8521Ixk
We have an issue with a page when it's running in Azure!
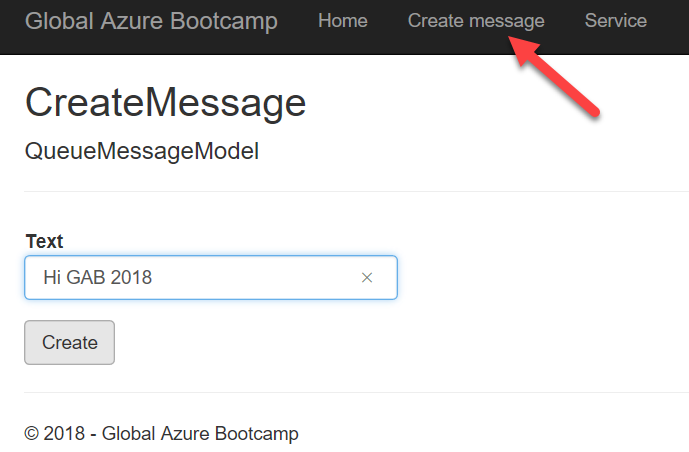
Navigate to the CreateMessage page, fill and submit the form. Explain that this error only happens when the app is deployed in Azure.
One way to get the information we need is run the app in debug mode in Visual Studio but how do do you attach the debugger to a live app running in Azure?
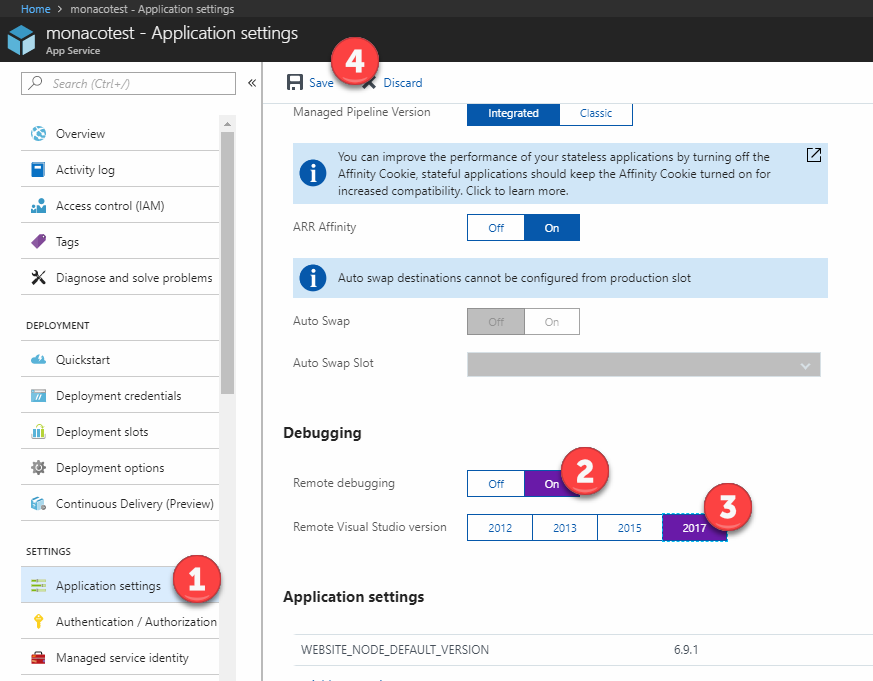
Navigate to the Azure portal. In the App Service Settings section of our Web App, click on Application Settings. Scroll to the Debugging section and turn remote debugging ON and select the Visual Studio version
In Visual Studio, open the Web.config file and validate that the debug attribute of the compilation setting is set to true.
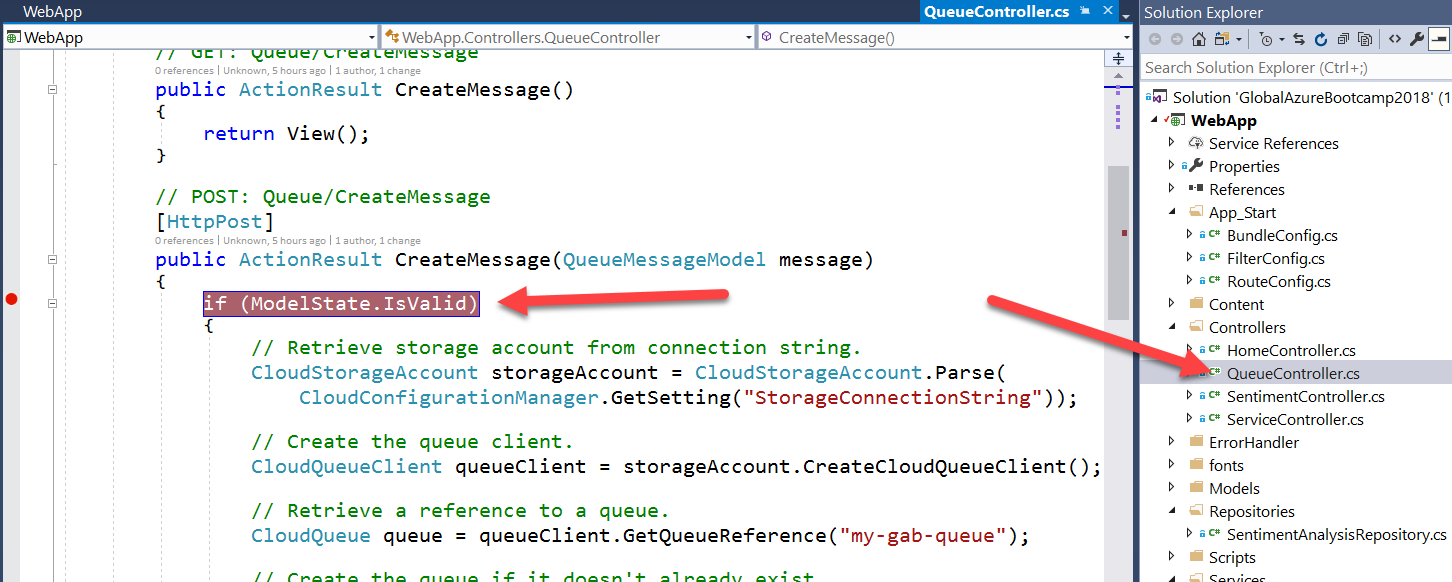
Open the QueueController.cs class and place a breakpoint in the CreateMessage method on this line:
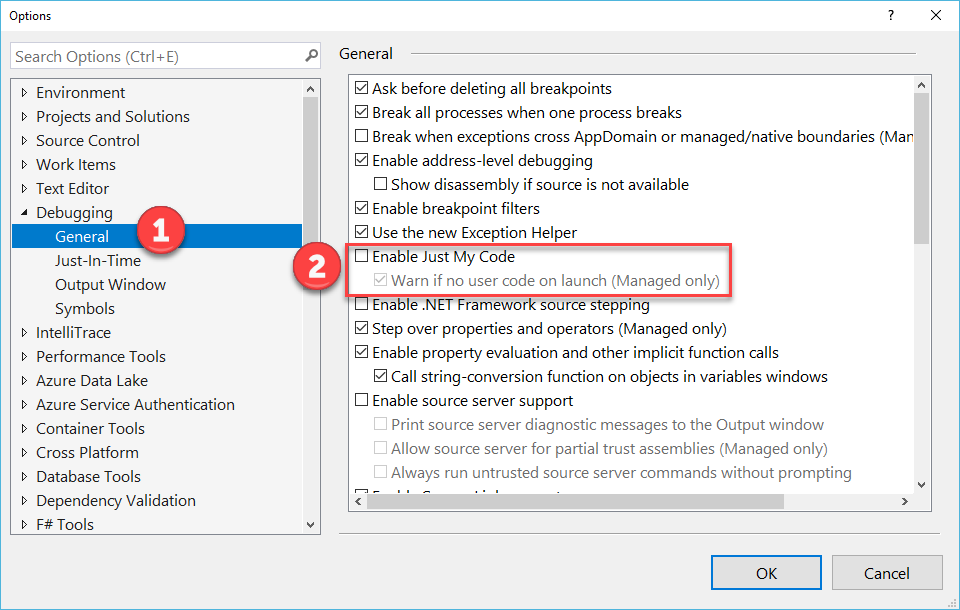
Open the Tools/Options dialog and select the Debugging/General section. Uncheck the Enable Just My Code setting.
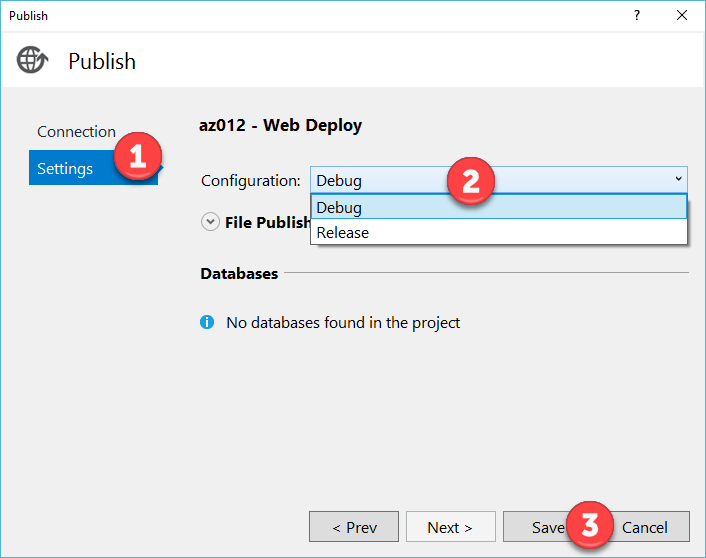
The app was previously published in release mode. We need to change this to Debug. In Solution Explorer, right-click on the project name and select Publish. Click on Setting and in the Publish dialog, click Settings. Change the Configuration to Debug and the Save button
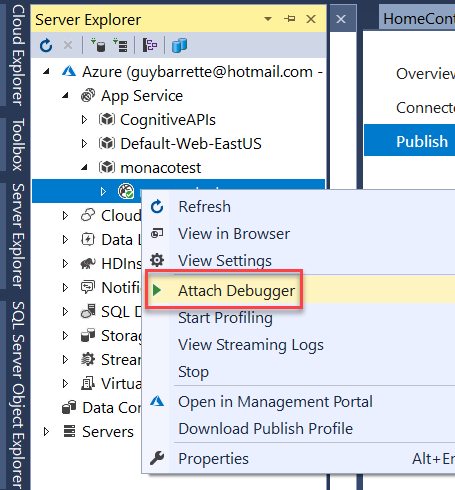
Click Publish. Visual Studio will launch the application browser but the debugger is not attached yet. Open the Server Explorer window, select the App Service, right-clik on the Web App and select Attach Debugger.
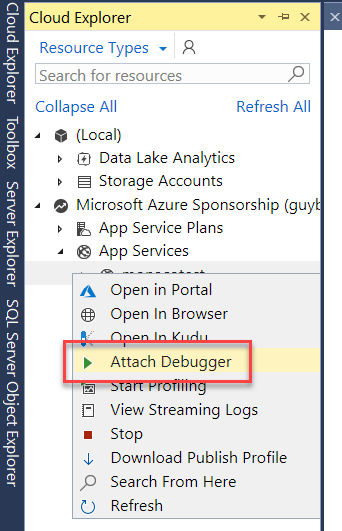
Explain that if they have the Cloud Explorer installed, they can do the same thing from that window. Visual Studio will launch a browser and run the app with the debugger attached. Navigate to the page and the breakpoint will be hit.
You can now step by using the F10 key like you're debugging local code. Where's the error? We're missing the storage account connection string! It was working locally because we used dev storage.
<add key="StorageConnectionString" value="UseDevelopmentStorage=true;" />To fix the issue, you need to create a new App Setting key in the portal named StorageConnectionString with the storage account connection string as the value but don't do that right now, we need this error again in "Step 7- Application Insights 2".
Hitting a breakpoint will stop the execution thread in Azure. Demonstrate that by opening the same page in a new browser tab. Execution has stopped on both page. INSIST ON TELLING THE AUDIENCE THAT THEY SHOULD ONLY DO THIS ON NON PRODUCTION APPS!!!
Take the time to watch this video that explains the whole process:
Take the time to watch this video that shows both tools:
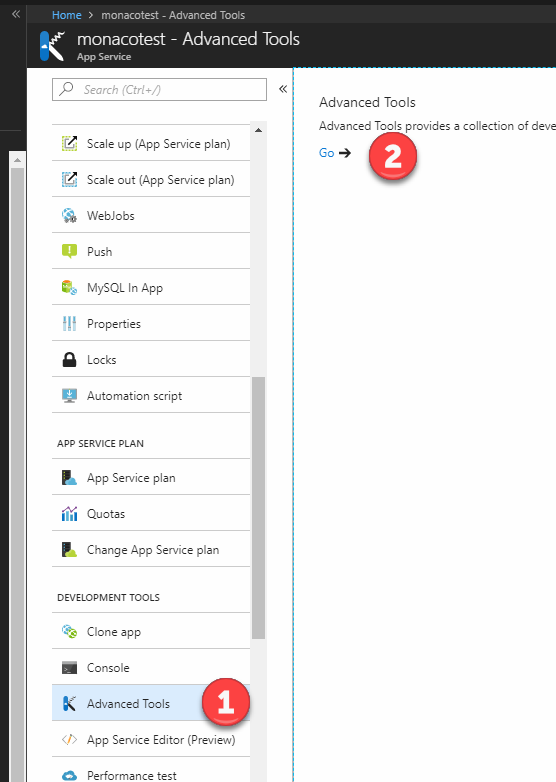
There's a little known cool feature called Kudu that provides a ton of helpful information. In the Development Tools section of our App Service, click on Advanced Tools and then click Go.
Explain that this will launch a new browser window with the Kudu tools. Show the URL and point to the SCM inserted in the URL. This is how that can directly reach Kudu for their Web sites.
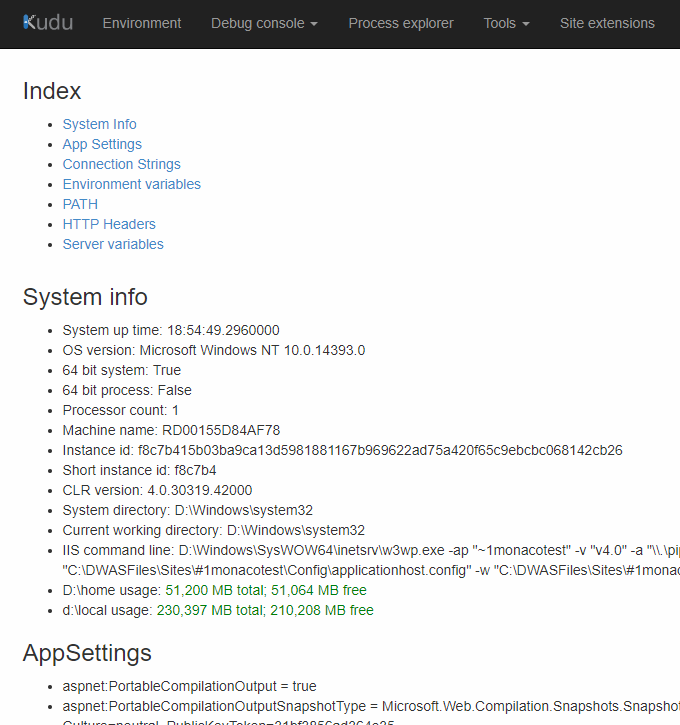
Click on Environment and explain that they get server information useful for debugging like the App Settings, the connection strings and HTTP headers.
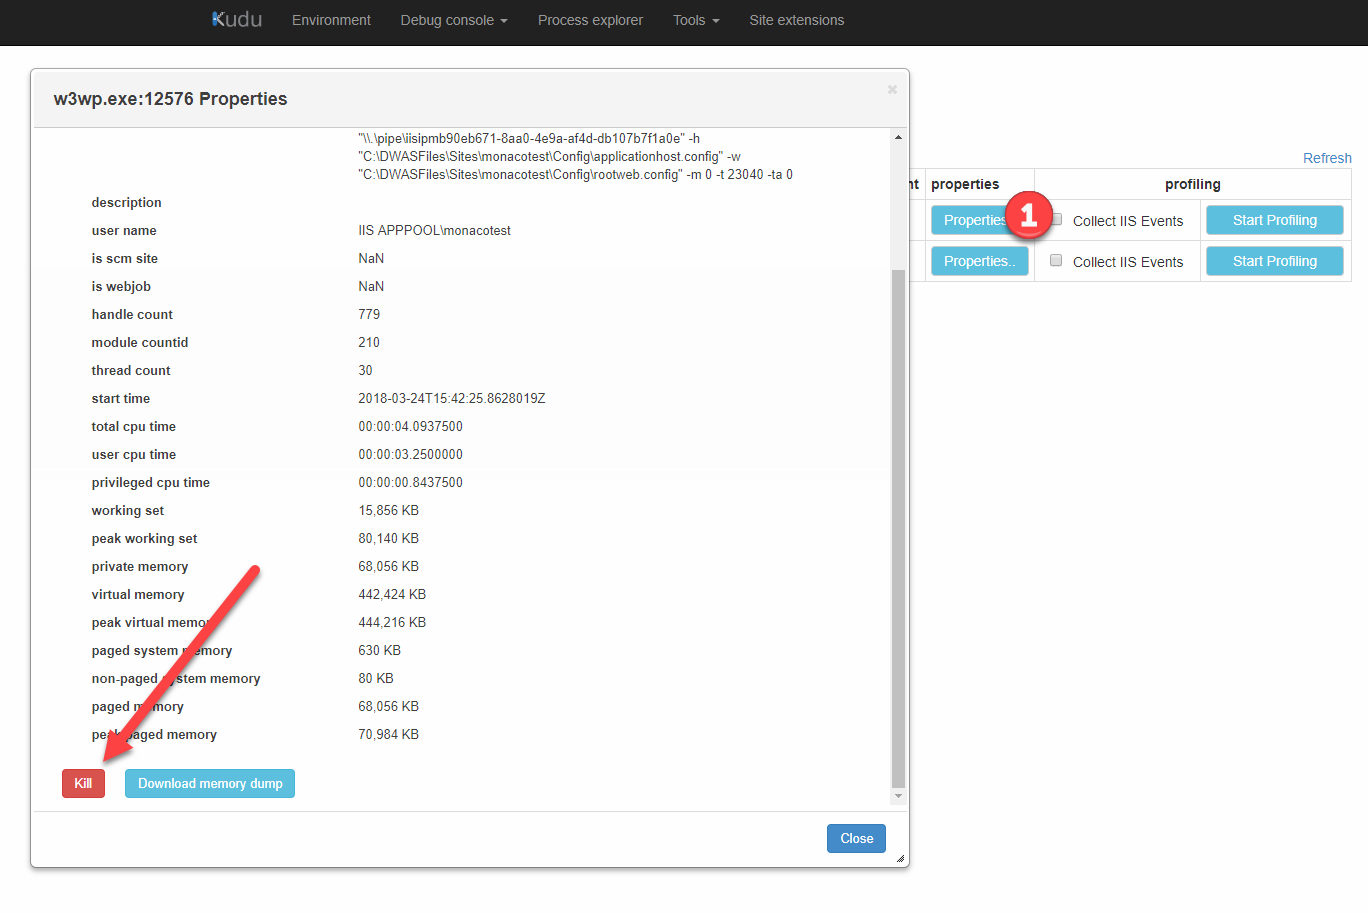
Click on Process Explorer and explain that the screen will list the IIS process running. Explain that the one with SCM is the one running Kudu.
Explain that you can look at the process properties and even profile it. Scrolling down the General tab will show a Kill button. Very usefull if you can't retart the Web App from the Portal.
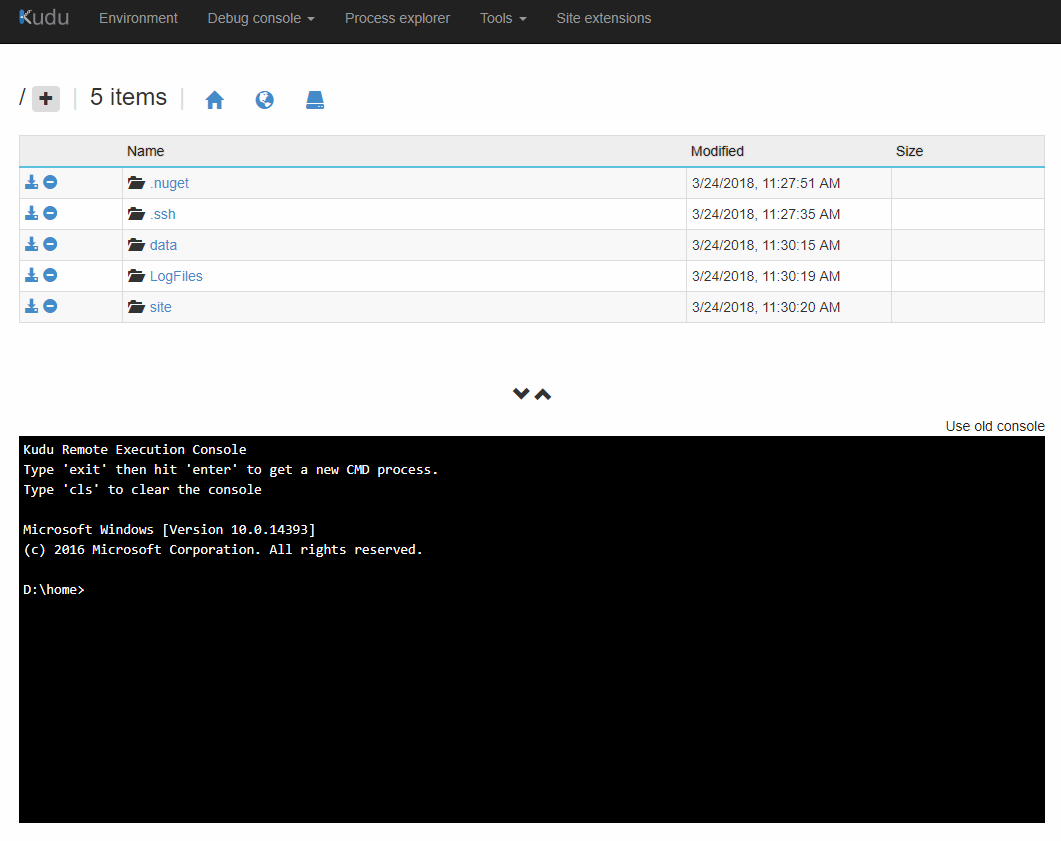
Click on Debug Console and select CMD. This will launch a Command Prompt console. Explain that you can navigate using the UI at the top of type commands in the console section.
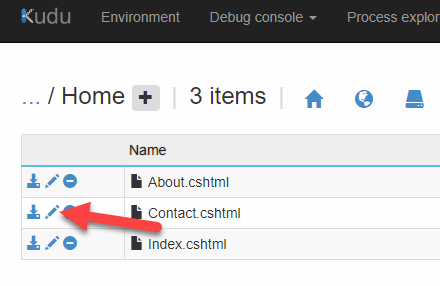
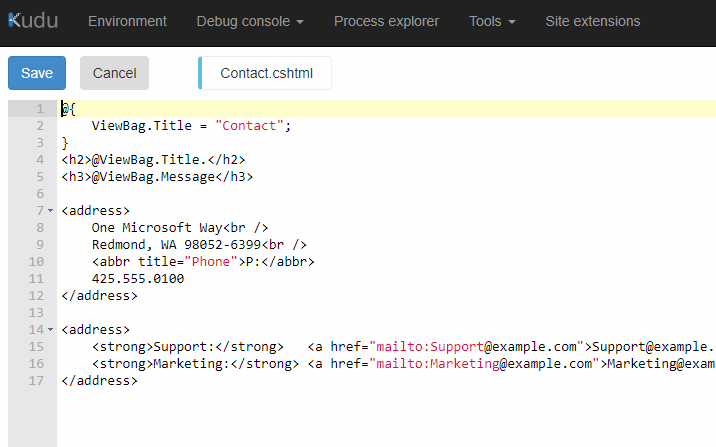
Show that you can edit a file directly in the browser. It is VERY IMPORTANT that you state that this is against best practices since the changes made outside of the normal source control and deployment process.
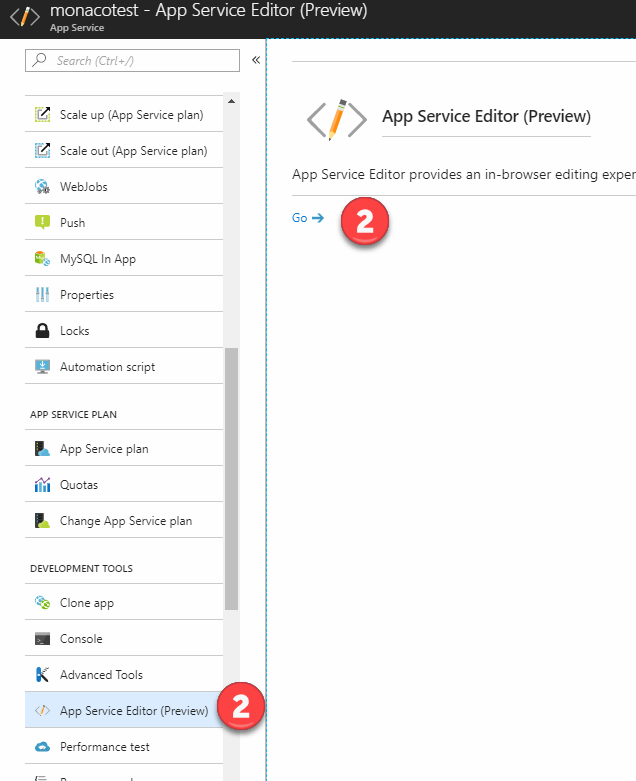
The App Service Editor provides scaled down version Of Visual Studio Code but in a browser. In the Development Tools section of our App Service, click on App Service Editor and then click Go. This will launch the editor in a new browser window.
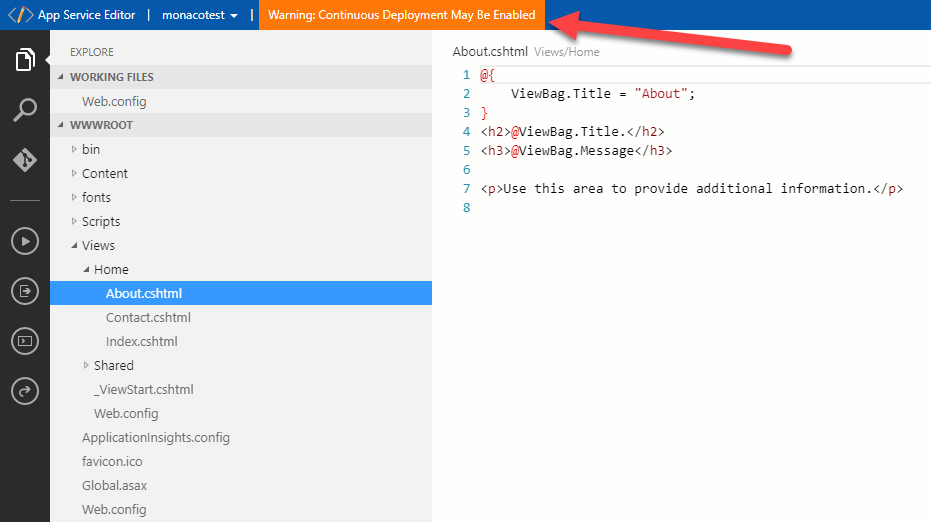
From there, you can edit the files directly. It is VERY IMPORTANT that you state that this is against best practices since the changes made outside of the normal source control and deployment process. When continous deployment is configured, the editor will display a warning in the in the toolbar. Clicking on the warning provides detailed info on this.
More important, point out that edits are automatically saved, there's no Save button. This can lead to disastreous results if the file is saved in the middle of your edit. It is VERY IMPORTANT that you state that this! One way to easily demonstrate this side effect is by editing the Web.config file. If you add a new App Setting key, partial changes will be saved causing an error.

