-
Notifications
You must be signed in to change notification settings - Fork 102
Reports
Analysis Summary report shows some common issues observed on your system that can have performance impact. This report gathers data from many different files captured by pssdiag.

High number of locks not only are risk of causing blocking but also can cause query to consume more CPU with exact same query plans.
This report give you a overview number of locks being held or waited on by each resource type.
- The data used by this report is collected in file _Perf_Stats_Startup.OUT. Example file name: MyServer_MyInstance_SQL_2014_Perf_Stats_Startup.OUT
- The data is identified as "-- Lock summary –" in the data collection
- The top chart aggregates lock counts by resource type over time. “All” means that it aggregates over all resource type.
- The bottom table allows you drill into each database about lock count
- Main table used is dbo.tbl_locksummary if you need more granular analysis

A bottleneck analysis means identify all the parameter(CPU, Memory, Disk IO...etc.) which are causing the degrade the performance of SQL Server.
This report will give you an overview of all the probable cause of degrade the performance of SQL Server in terms of CPU, Memory, Disk..etc.
The data is collected in file _TimeStamp_PerfStats.out and _HighCPU_perfstats.out. Example file: MyServer_MyInstance_MiscPssdiagInfo_Startup.OUT and MyServer_MyInstance_TimeStamp_PerfStats.out
- The top chart aggregates the CPU usages percentage with respect to time stamp for SQL Usages CPU as well as nonsql CPU usages.
- The second chart shows you the top wait types with respect to CPU usages of each wait types. So that user will have an idea that which wait type is causing more CPU which causes performance degrade.

Pssdiag captures top CPU consuming query plans. This report analyzes the query plans. Currently it only produces tables used by these plans. This is very helpful if you don’t have time windows to update statistics on all the tables. You can focus on these tables because they were used by the top CPU consuming query plans.

This report shows database properties such as auto close, auto stats etc. It also shows all database files.
- The data is collected in file _MiscPssdiagInfo_Startup.OUT. Example file: MyServer_MyInstance_MiscPssdiagInfo_Startup.OUT
- The data is identified as
- "--sys.databases_ex—--"
- "--database files--"
- The chart will color code (red) for any databases that have auto update or auto create stats disabled
- tbl_DatabaseFiles and tbl_SysDatabases contain data for this report

This report shows common server properties:
- general server information
- sp_configure
- trace flags
- startup parameters

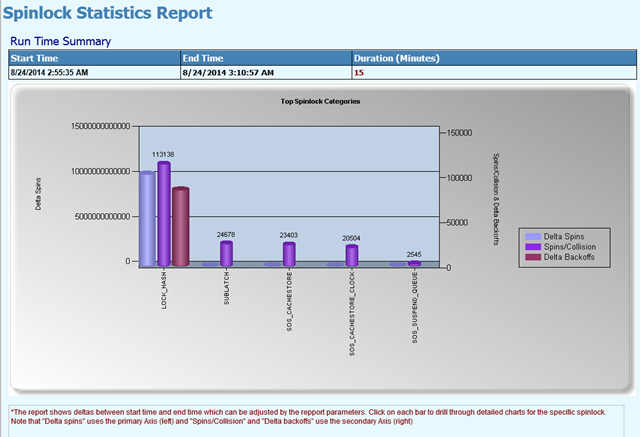
This report charts spinlock statistics such as delta spins and backoffs. It also drill through on specific spinlocks.


As we know that how pssdiag or SQLLogScout data can be imported in SQL database, and the reports can be viewed in SQL Nexus tool but here we will generate the report using excel.
For example below is a sample query to pull the record for min/max/avg values for perfmon counters from SQLNexus database.
    SELECT objectname, countername, instancename, MIN(countervalue) AS 'MIN',
        MAX(countervalue) AS 'MAX', AVG(countervalue) AS 'AVG' FROM Counterdetails a
    INNER JOIN CounterData b ON a.counterid = b.counterid
    GROUP BY objectname, countername, instancename
    ORDER BY objectname, countername, instancename
Output will be looks like below screenshot:

This can help narrow down issue most of the time. Sometimes you do want to see the graph though. (maybe some counter had a spike up intermittently and that was the cause or symptom of the issue.)
Let's run the following query in grid mode in SSMS.
SELECT objectname, countername, instancename, CounterDateTime, CounterValue
FROM Counterdetails a
INNER JOIN CounterData b ON a.counterid = b.counterid
ORDER BY objectname, countername, instancename, a.counterid, recordindex
Now save the results of the above query output as a CSV file. Add a header to CSV for better preserve understanding of the column.

Now create a pivot table including all column and create the graph with avg values etc.

Depending on the data in the database you may find the data load take a long time. In such case you could probably use datetime filters to reduce amount of data.