This Project simulates the movement of a Player in the game of Monopoly. Once the simulation is over statistics are displayed.
- Logging - Each movement on the board is displayed as a log message in the terminal, which represents the current tile the Player is on, the dice roll and the number of times the Player have crossed the 'Go' Tile. This way we can see the progress of the Player in the simulation. For example:
Current tile: ['Green #2'] - North Carolina Avenue, Rolled: 7, Crossed GO: 98x
-
Saved Text Output - Tile visit statistics data are sorted and save to Output files.
-
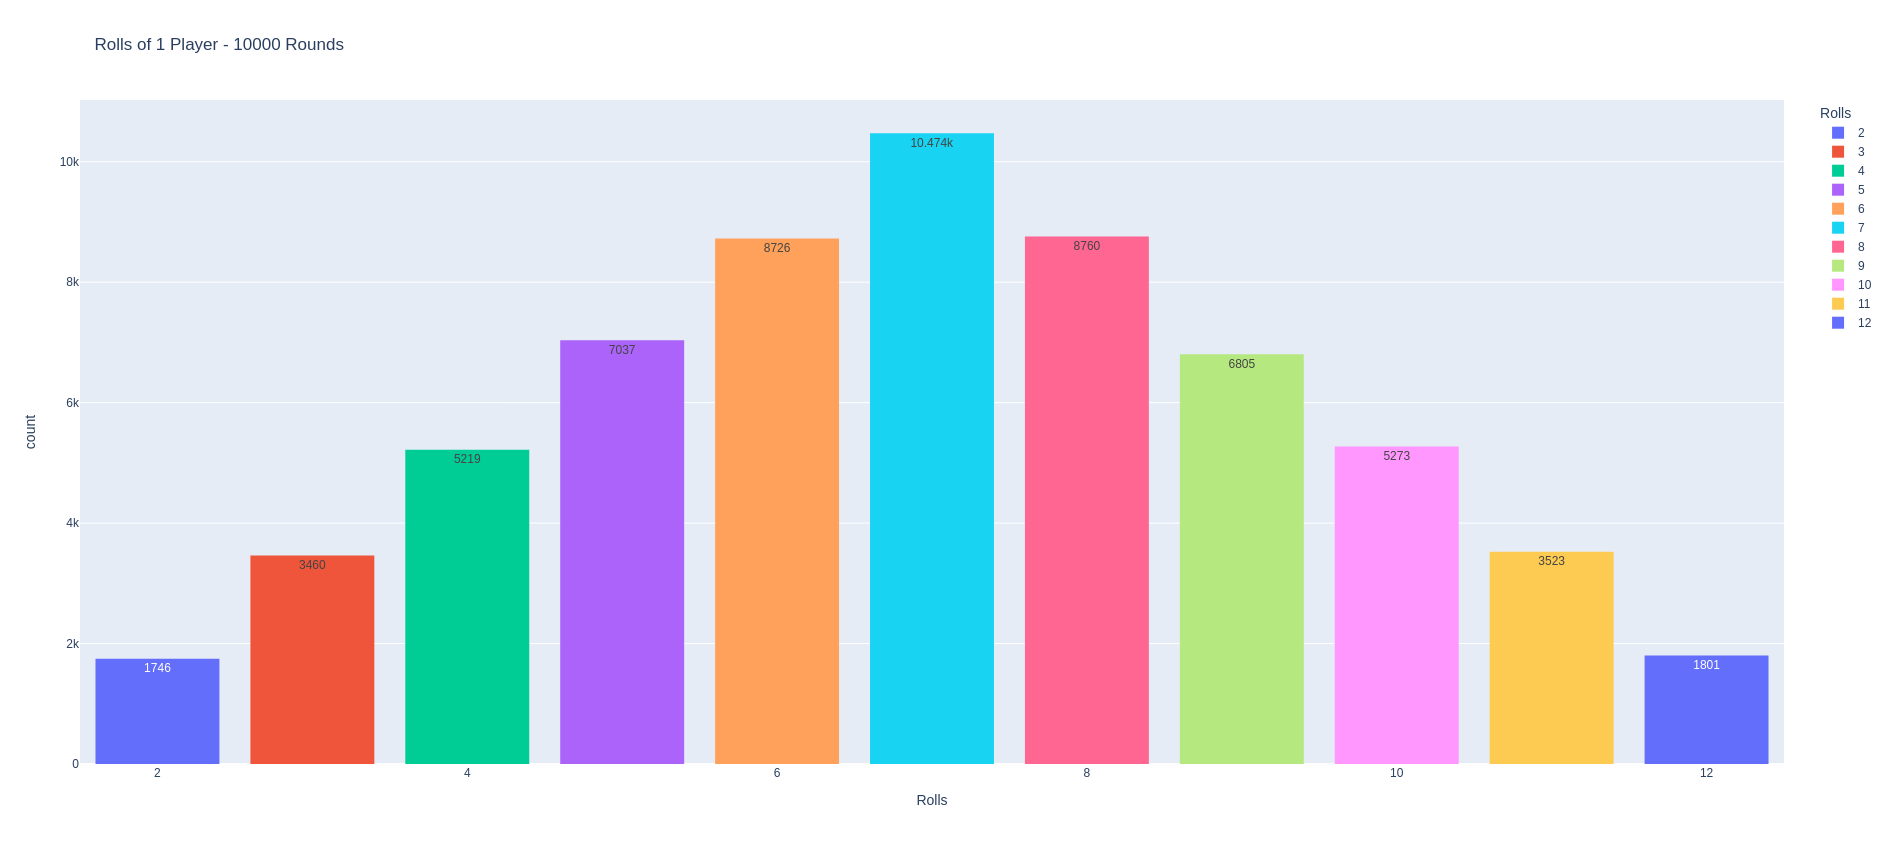
Dice Roll Distribution Plots - Distribution of dice roll sums are displayed in interactive count plots.

-
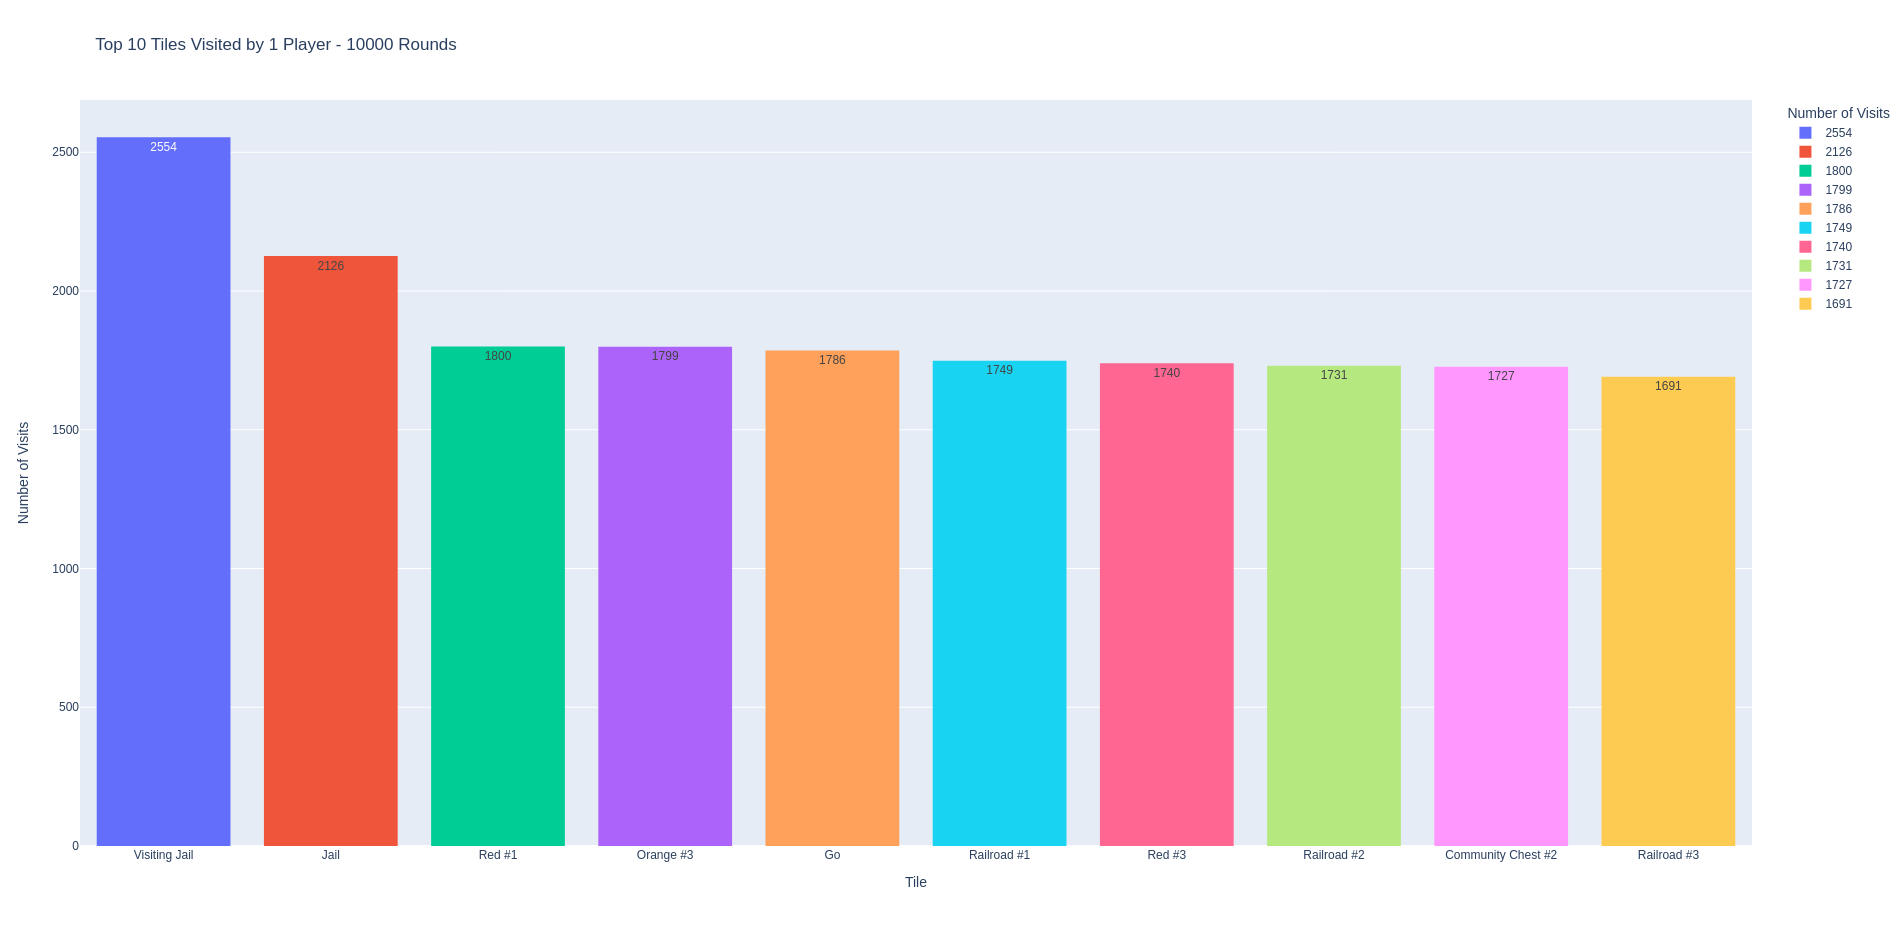
Top 10 Visited Tiles Plots - Top 10 most visited tiles are also displayed and saved.

-
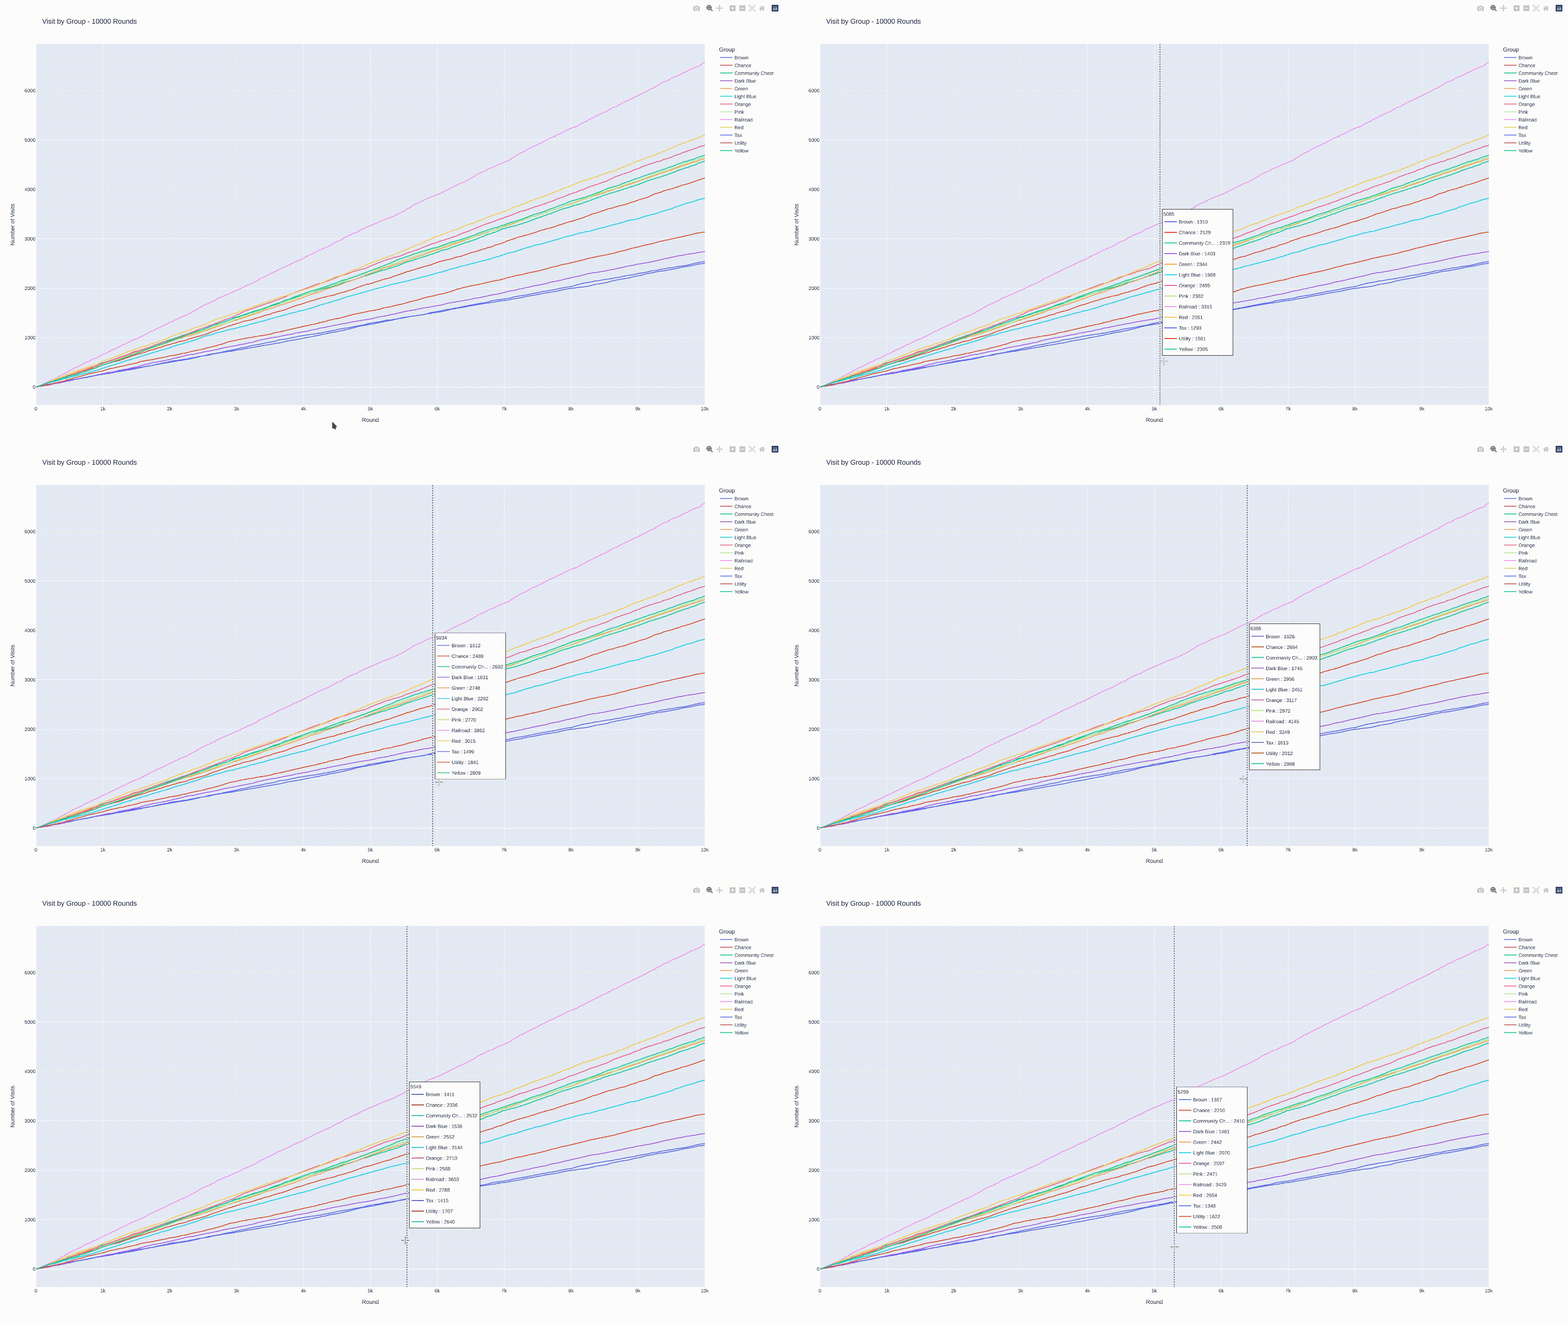
Grouped Visit Line Charts - We can look into tile group based visits in interactive line chart.


-
Board Heatmaps - Based on the collected data a heatmap is also generated.

To get a local copy up and running follow these simple steps.
- Python 3.10.x - It is either installed on your Linux distribution or on other Operating Systems you can get it from the Official Website, Microsoft Store or through
Windows Subsystem for Linux (WSL)using this article.
-
Clone the repo
git clone https://github.com/Raychani1/Monopoly_Simulation.git
-
Navigate to the project folder and call the Executor script
On Linux:
./Monopoly_Simulation [Number of Rounds]
On Windows:
.\Monopoly_Simulation.ps1 [Number of Rounds]
Distributed under the MIT License. See LICENSE for more information.


