Home
#Overview ae-timelines is a JavaScript library, built using Webcharts (1, 2), that creates an interactive timeline showing when participants experienced Adverse Events in a clinical trial. The chart uses the AdAM Adverse Event data standard by default, but can be customized to use any data set that is one record per adverse event. Full details about chart configuration are here. Users can:
- See the AE timeline for an overview of adverse events
- See the number and percentage of participants displayed in the current view (updates with each user interaction)
- Change the input on the serious event filter, and see an updated chart
- Change the input on the severity/intensity filter, and see an updated chart
- Change the input on the subject identifier filter, and see an updated chart
- Sort subject IDs by the earliest occurring event or alphabetical/descending order, and see an updated chart
- Display metadata when hovering over a bar
- Click a participant to see a detailed view of their adverse events and the underlying data
- Navigate from the detailed view back to the main page
- Filter the histogram for selected criteria, and see an updated chart (optional)
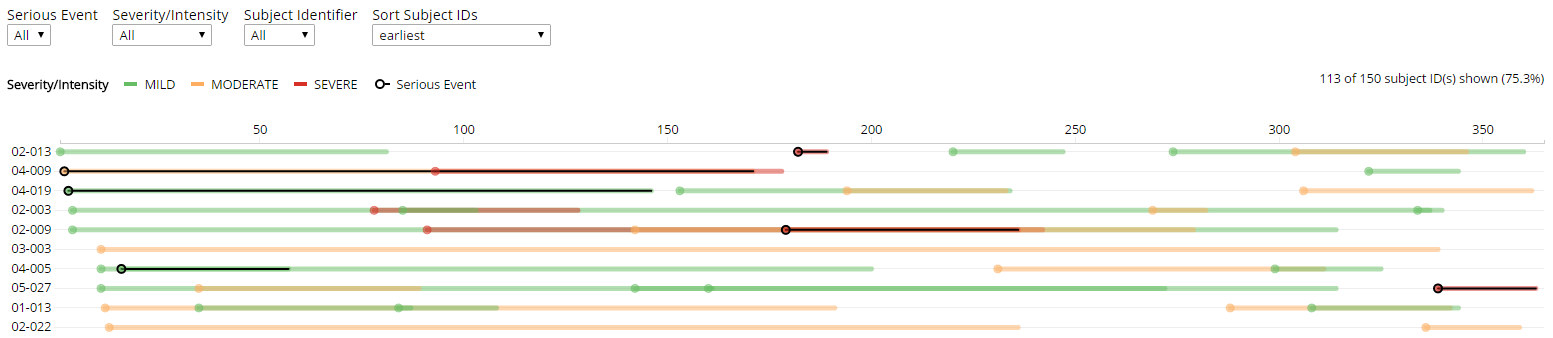
#Typical Usage A typical chart created with ae-timelines looks like this when it is first loaded:
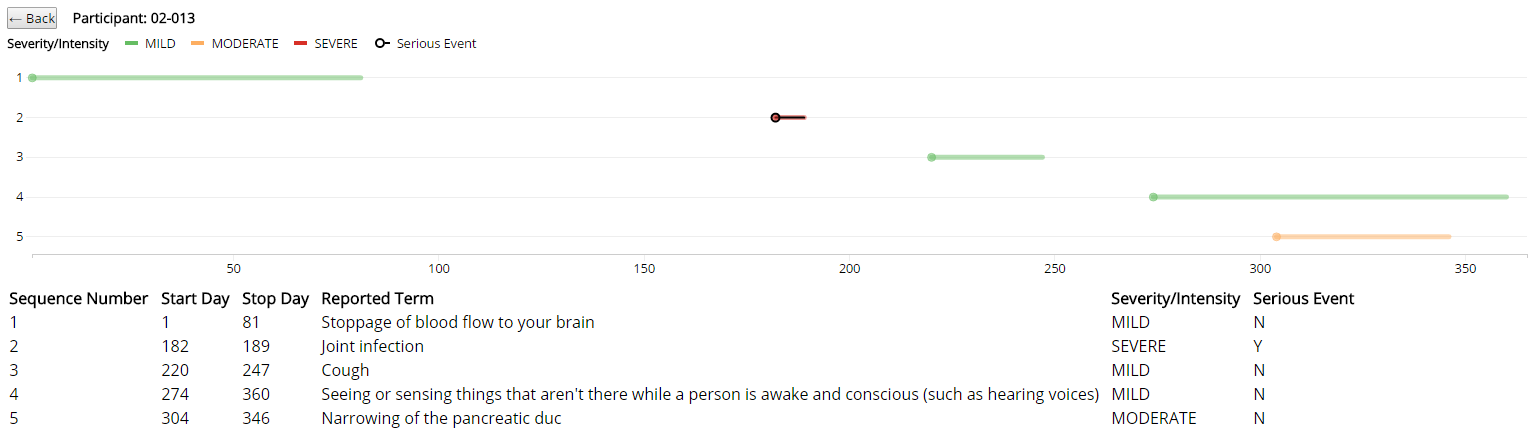
Clicking on an individual participant id (a label on the y-axis) opens a participant view like this:
Assuming the data matches the AdAM standard, the code to initialize the chart looks like this:
var div = 'body';
var dataFile = 'ae_explorer.csv';
d3.csv(dataFile, function (data){
  var plot = aeTimelines(div, {}).init(data);
});
Many configurable settings are provide to facilitate different data formats and display customizations. Just provide a custom settings to overwrite the defaults, like this:
var settings = {
  legend: {
    order: ['MILD', 'MODERATE', 'SEVERE', 'NA'], //some severity marked as "NA"
    location:"right"
  },
  colors: ['green', '#ffff33', 'red', '#444'], //custom colors to handle NA
  stdy_col: 'AESTDY', //Overwrites default AdAM value
  endy_col: 'AEENDY', //Overwrites default AdAM value
  date_format:"%Y-%m-%d" //Overwrites default value
};

var div = 'body';
var dataFile = 'ae_explorer.csv';
d3.csv(dataFile, function (data){
  var plot = aeTimelines(div, settings).init(data);
});
Click here to open an interactive version of the chart shown above.
#Examples