Data preparation is still a major bottleneck for many data science projects. A frequently cited survey in 2016 found that data scientists spend 60% of their time on data cleaning and organizing data. In the same survey, 57% of the data scientists also stated that they consider data cleaning and organizing data as the least enjoyable task of their job.
Over the years, many tools for profiling, preparing, and cleaning data have been developed, both in academia and industry (see [1, 2] for overviews). These approaches were developed in isolation and in different programming languages with no standardized interfaces. Thus, it is difficult for data scientists to combine existing tools and re-use them in their data processing pipelines.
Inspired by the wide adoption of generic machine learning frameworks such as scikit-learn, TensorFlow, and PyTorch, we are currently developing openclean, an open-source Python library for data profiling and data cleaning. The source code for openclean is available on GitHub.
Our goals for openclean are twofold. First, we aim to provide a unified framework for practitioners that brings together open-source data profiling and data cleaning tools into an easy-to-use environment. By making existing tools available to a large user-community, and through the integration with the rich Python ecosystem, openclean has the potential to simplify data cleaning tasks. Second, by providing a structured, extensible framework, openclean can serve as a platform to which researchers and developers can contribute their techniques. We hope that by bringing together a community of users, developers, and researchers, we will be in a better position to attack the many challenges in dealing with data quality.
openclean has many features that make the data wrangling experience straightforward. It shines particularly in these areas:
- Data Profiling: openclean comes with a profiler to provide users actionable metrics about data quality. It allows users to detect possible problems early on by providing various statistical measures of the data from min-max frequencies, to uniqueness and entropy calculations.
- Data Cleaning & Wrangling: openclean's operators have been created specifically to handle data janitorial tasks. They help identify and present statistical anomalies, fix functional dependency violations, locate and update spelling mistakes, and handle missing values gracefully.
- Data Enrichment: openclean seamlessly integrates with the Socrata Open Data API and the Reference Data Repository giving users easy access to standard datasets which can be incorporated in the data cleaning process.
- Data Provenance: openclean comes with a mini-version control engine that allows users to maintain versions of their datasets and at any point commit, checkout or rollback changes.
In the following we give an overview of the basic operators and concepts in openclean using a running example. A Jupyter notebook containing an extended and more detailed version of this example is included in the openclean repository (see the README file for installation instructions).
The dataset that is used for all the examples is the NYC Parking Violations Issued - Fiscal Year 2014, which contains violations issued during the 2014 fiscal year. This dataset contains several data quality problems and is a great example for demonstrating data profiling and data cleaning steps. The dataset consists of over 9 million rows and the compressed data file is about 380 MB in size (~1.7 GB uncompressed).
The dataset is available for download via the Socrata Open Data API (SODA). To download the dataset, openclean includes a SODA wrapper that provides access to all datasets available via the API using their unique identifier. The parking violations dataset, for example, has the unique identifier jt7v-77mi. The identifier is part of the dataset Url https://data.cityofnewyork.us/City-Government/Parking-Violations-Issued-Fiscal-Year-2014/jt7v-77mi. The following code downloads the dataset in tab-delimited CSV format and stores it in a local file called jt7v-77mi.tsv.gz.
import gzip
import os
from openclean.data.source.socrata import Socrata

datafile =  './jt7v-77mi.tsv.gz'
dataset = Socrata().dataset('jt7v-77mi')

with gzip.open(datafile, 'wb') as f:
    dataset.write(f)
openclean is primarily intended for tabular datasets, which are represented as pandas data frames. After downloading the dataset file, we can, for example, open it as a data frame using the pandas.read_csv() function. This requires reading the full dataset into main memory. For large datasets this may not be feasible, and in some cases we don’t need all the data. For these scenarios, openclean’s data streaming operator allows us to apply data profiling, filtering, and transformation operations directly on a stream of rows that are read from the file. As an example, the created data stream has a head() operator that by default will return the first ten rows from the dataset file as a pandas.DataFrame.
from openclean.pipeline import stream

ds = stream(datafile)
ds.head()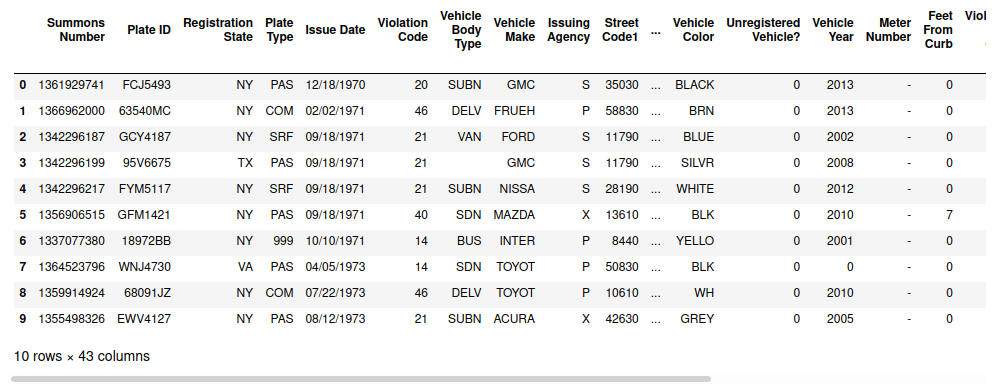
Data profiling is an important first step in many data analytic efforts. Profiling helps users to gain an understanding of the data properties and to uncover data quality flaws. openclean supports a variety of different data profiling operators that can also be used to generate metadata about the data at hand.
We can use the default column profiler to compute basic statistics such as the number of distinct values, missing values, etc. for each of the columns in our dataset. In the example shown below we use a random sample of 1000 rows for profiling. The result is a list of profiling results (dictionaries). A summary of the results can then be accessed as a data frame using the stats() method.
from openclean.profiling.column import DefaultColumnProfiler

profiles = ds\
    .sample(n=1000, random_state=42)\
    .profile(default_profiler=DefaultColumnProfiler)

profiles.stats()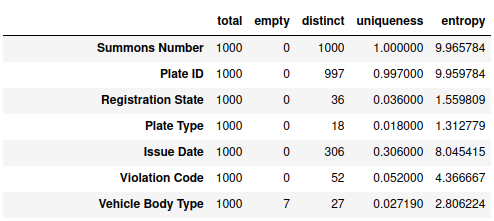
openclean is designed to be extensible, to make it easy to add new functionality, and to customize data profiling and cleaning operators. In the previous example, we could use any profiler that implements the openclean.profiling.base.DataProfiler class instead of the default profiler. One example is the datamart-profiler (used by the notebook extension of openclean) that provides a richer set of metadata and more powerful data type detection compared to the default column profiler (see discussion in GUI - Integration with Jupyter Notebooks).
One common profiling task is the detection of outliers (anomalies) in datasets. In our example we focus on outlier values in individual columns. This example looks at the distinct values in the column Registration State. It shows that the column contains a total of 69 values, which is more than the 50 U.S. states and even two more than in the list of state codes that is published by the NYC Department of Finance.
states = ds.distinct('Registration State')
for rank, val in  enumerate(states.most_common()):
    st, freq = val
    freq = '{:,}'.format(freq)
    print('{:<3} {} {:>9}'.format('{}.'.format(rank +  1), st, freq))
1. NY 7,029,804
2. NJ 878,677
3. PA 225,760
4. CT 136,973
...
66. YT 14
67. FO 9
68. NT 6
69. NF 1One solution to identify the invalid values is to use a curated list of license plate state codes. Reference data is an important tool for data cleaning and openclean supports the use of different reference datasets. For this purpose, we created the open-source library refdata to provide access to reference datasets available on the Web. Individual datasets are hosted by data maintainers on the platform of their choice. Users can download copies of the datasets for local access.
The official list of license plate states has 67 values (including the 50 U.S. states, provinces and territories in Canada, Mexico, U.S. government vehicles). In the following we show how to use openclean's reference data repository to help identify the two values in the Registration State column that do not occur in the reference list. We first load the dataset containing the official list of registration state codes (the auto_download flag ensures that the dataset will be downloaded if it does not exist in the local repository). You can use refdata.repository().find() to get a full list of available datasets. After loading the dataset we get a list of distinct values in the code column. You can use df() if you want to get a data frame containing the whole dataset, instead. The result shows that 99 and PR are the two values that do not occur in the reference dataset.
from openclean.data.refdata import RefStore

states_ref = RefStore()\
    .load('nyc.gov:dof:state_codes', auto_download=True)\
    .distinct('code')

for rank, val in  enumerate(states.most_common()):
    st, freq = val
    if st not  in states_ref:
        freq = '{:,}'.format(freq)
        print('{:<3} {} {:>9}'.format('{}.'.format(rank +  1), st, freq))
11. 99 38,080
60. PR 211The full notebook contains additional examples showing how to identify anomalies using statistical outlier detection methods from scikit-learn that are accessible in openclean.
Data standardization is another important data preparation task. Different representations of the same value are common in many datasets, e.g., caused by misspellings during manual data entry. In the following we show two approaches for identifying such different representations: (1) clustering, and (2) violations of functional dependencies.
openclean provides functionality for grouping values based on similarity. This functionality is adapted from OpenRefine Clustering. The main idea is to identify clusters of values that are different but might be alternative representations of the same entity.
One clustering algorithm that is included in openclean is key collision clustering. The main idea of key collision methods is to create an alternative representation for each value (i.e., a key), and then group values based on their keys. The default key generator on openclean is the fingerprint that was adopted from OpenRefine.
In this example we take a look at the Street column that contains the names of streets where a parking violation occurred. Street address columns can be very noisy due to different abbreviations, different representations for street numbers, etc. (e.g., 5 Ave vs. Fifth Avenue vs. 5th Av). We first account for differences in values due to different case letters. We then use the default key collision clustering to generate clusters of street names that are likely to be different representations of the same street.
from openclean.cluster.key import KeyCollision
from openclean.function.value.key.fingerprint import Fingerprint

street_names = ds.update('Street', str.upper).distinct('Street')
clusters = KeyCollision(func=Fingerprint()).clusters(street_names)
Below we show one of the clusters that is included in the generated set of key collision clusters. The numbers in brackets denote the frequency of the values in the dataset.
W 125 ST (x 3365)
W 125    ST (x 1)
W. 125 ST. (x 1)
W .125 ST (x 5)
W  125 ST (x 2)
W 125  ST (x 1)
W. 125 ST (x 3)
The example shows that the default fingerprint key generator already provides some promising results. The method, however, misses many cases that we found are common in U.S. street address columns. A few examples are:
-
Different abbreviations for street types, e.g., 125 St vs. 125 Str vs. 125 Street.
-
Missing whitespace between street number and street type, e.g, 125St vs. 125 St.
-
Text representations of street numbers, e.g., Fifth Ave vs. 5th Ave vs. 5 Ave.
To address these issues, the geospatial extension package for openclean contains a specialized key generator and value standardizer that are demonstrated in the following. Take a look at the openclean.function.token.base.Tokens class, for example, if you want to create your own customized key generator.
The following code uses the custom USStreetNameKey key generator and shows some of the values in the generated cluster for West 125 Street. In total, the cluster contains 36 different representations of the street name. The cluster is significantly larger than the previous cluster with only seven values. This shows one of the advantages of openclean in being customizable using domain specific functionality.
from openclean_geo.address.usstreet import USStreetNameKey

clusters = KeyCollision(func=USStreetNameKey()).clusters(street_names)
W 125 ST (x 3365)
W 125 ST (x 1)
W 125 STREET (x 451)
WEST 125 ST (x 522)
WEST 125TH ST (x 81)
W 125TH ST (x 11611)
WEST 125 STREET (x 354)
W 125 TH ST (x 18)
WEST 125TH STREET (x 73)
W 125TH STREET (x 169)Another way of identifying possible different representations is by detecting sets of values that violate constraints one would expect to hold over the data. For example, the combination of Plate ID and Registration State should uniquely identify a vehicle. For each vehicle we make the assumption that the vehicle color doesn't change within one financial year. Thus, the functional dependency that [Plate ID, Registration State] determines the Vehicle Color should hold. Violations of that dependency point to different representations of the same color value. Note that even if the dependency does not hold in all cases the majority of violations that we discover do point to different representations of the same color rather than to cases where the color of a vehicle did change.
from openclean.function.eval.base import Col
from openclean.function.eval.logic import And
from openclean.operator.map.violations import fd_violations

df = ds\
    .select(['Plate ID', 'Registration State', 'Vehicle Color'])\
    .rename('Registration State', 'State')\
    .where(And(Col('State') !=  '99', Col('Plate ID') !=  '999'))\
    .update('Vehicle Color', str.upper)\
    .to_df()

groups = fd_violations(df, lhs=['Plate ID', 'State'], rhs='Vehicle Color')
Below are three examples for groups of tuples that violate the functional dependency. In two cases it appears as if (WHITE, WH) and (BROWN, BR) are representations for the same color, i.e., giving us an indication for a possible mapping to standardize vehicle colors. The third example does show the limitations of this approach with BLUE and BROWN unlikely being representations of the same color.
Plate ID State Vehicle Color
85134MC  NY    WHITE
85134MC  NY    WH
85134MC  NY    WH
85134MC  NY    WHITE

Plate ID State Vehicle Color
93310JT  NY    BROWN
93310JT  NY    BROWN
93310JT  NY    BR
93310JT  NY    BROWN
93310JT  NY    BROWN

Plate ID State Vehicle Color
49744JG  NY    BLUE
49744JG  NY    BROWN
49744JG NY BROWNData profiling and cleaning are inherently exploratory tasks. In many scenarios the user needs to visualize data and profiling results (statistics) to get a better understanding of data properties and existing quality issues, or may identify a data quality issue by examining the predictions of a machine learning model. Many existing cleaning tools like OpenRefine or Trifacta Data Wrangler come with graphical user interfaces (GUIs) to make it easier for users to explore and clean their data.
Instead of relying on a dedicated GUI, openclean can be used in many different environments, including Jupyter Notebooks. Working in a Python or notebook environment allows users to more easily integrate data cleaning tasks with their data science pipelines. In addition to the ability to leverage existing libraries, openclean provides a spreadsheet-like GUI which enables users to visualize and interact with the data from a Jupyter Notebook.
To leverage the spreadsheet GUI, the datasets that are being manipulated need to be under the control of a openclean.engine.base.OpencleanEngine object. This object coordinates the communication between the Javascript front-end and the openclean backend. It also maintains provenance information about all the applied operators and allows users to view previous snapshots of the dataset and to rollback operations.
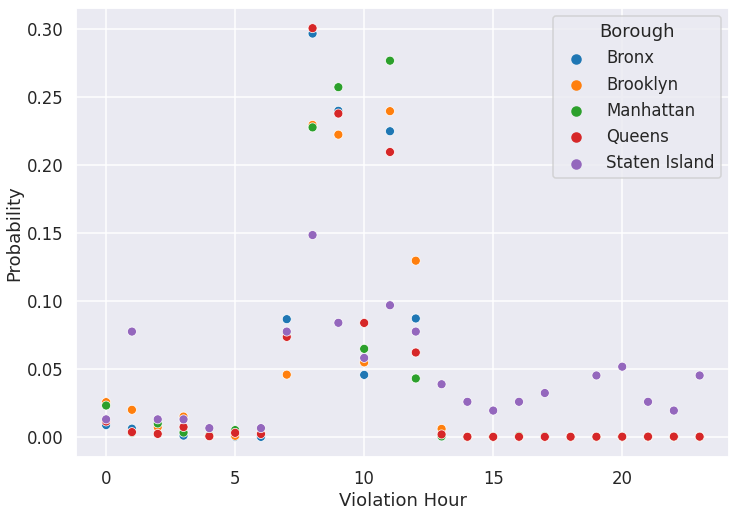
In this example, we take a look at the times of the day when one is more likely to receive a parking ticket during street cleaning (violation code 21) and whether there are differences between the five boroughs of New York City. We start by selecting the data of interest and then load the data frame into a database engine object that materializes all dataset snapshots as files in a folder on the local file system. Each dataset in the database is identified by a unique name (street_cleaning_violations in our example).
from openclean.function.eval.base import Col
from openclean.function.eval.domain import IsIn
from openclean.function.eval.regex import IsMatch
from openclean_notebook import DB

df = ds\
    .filter(IsIn('Violation County', {'K', 'NY', 'Q', 'BX', 'R'}))\
    .filter(IsMatch('Violation Time', pattern=r'\d{4}[AP]', fullmatch=True))\
    .filter(Col('Violation Code') == '21')\
    .rename('Violation County', 'Borough')\
    .select(['Borough', 'Violation Time'])\
    .to_df()

db = DB(basedir='.openclean', create=True)
df = db.load_dataset(df, 'street_cleaning_violations')
df.head()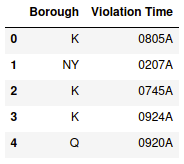
There is a 1:1 mapping between county codes and borough names that we can use to modify the data to get more meaningful values for the borough column. For details, please take a look at the full notebook. We also translate the violation time into a 24 hour value. This can be done using the user-defined time_to_hour24 function below. In this example, we also show how to register the function with the database object. All registered functions are then available to the user in the spreadsheet view and can be applied on the dataset columns. openclean also supports materialization of registered functions which makes it possible to re-use the functions in different notebooks or share them among trusted users.
@db.register.eval('time_to_hour')
def  time_to_hour24(value):
    if value.endswith('A'):
        return  int(value[:2])
    else:
        h =  int(value[:2])
        return h if h == 12 else h +  12

db.edit('street_cleaning_violations', n=1000, random_state=42)
The spreadsheet view provides easy-to-use visualizations for data analysis and exploration. It displays profiling results for each column, including inferred data types and statistical information such as mean, standard deviation, and unique values, at different levels of detail (compact, detail, and column views) together with histograms of column values and inferred column types.
The GUI allows users to apply transformation operators on the spreadsheet using registered functions. The history of applied functions is shown as part of the spreadsheet view, i.e., the recipe. In the example we use a sample. The recipe, once finished, can then be applied on the full dataset, either using the apply button or when checking out the full dataset after the user is done with the spreadsheet view.
df = db.checkout('street_cleaning_violations', commit=True)To conclude our example, we demonstrate how existing Python visualization packages (e.g., seaborn in this case) can be used to create a plot that shows how likely it is during different times of the day to receive a parking ticket (violation code 21) in each of the five boroughs of New York City. As one would expect, these tickets are frequently issued during the morning hours although this seems to be far less likely at 10 a.m. across all boroughs which would require further investigation to understand whether this is caused by a data quality problem or not.
This post gives an overview of the ideas and basic operators in openclean, a open-source Python library for data cleaning and profiling. openclean integrates data profiling and cleaning tools in a single environment that is easy and intuitive to use. We designed openclean to be extensible and make it easy to add new functionality. By doing so, it will not only become easier for users to access state-of-the-art algorithms for their data wrangling efforts, but also allow researchers to integrate their work and evaluate its effectiveness in practice. In future posts, we will discuss how interested developers and researchers can integrate their data profiling and cleaning algorithms into openclean.
To try out openclean, please have a look at the GitHub repository and the example notebooks.
This work was partially supported by the DARPA D3M program, NSF awards OAC-1640864 and OAC-1841471, and the NYU Moore Sloan Data Science Environment.
[1] Ziawasch Abedjan, Lukasz Golab, and Felix Naumann. Profiling Relational Data: A Survey (2015). The VLDB Journal, 24, 4.
[2] Mazhar Hameed and Felix Naumann. Data Preparation: A Survey of Commercial Tools (2020). SIGMOD Rec. 49, 3.