[HELP] Guide for using Influx db with Speedtest-Tracker #371
Replies: 22 comments 4 replies
-
|
You don't really expect a guide on using Grafana, right? :) But you're a really lucky person, I already prepared the dashboard for influxdb v2: alexjustesen/speedtest-tracker-docs#4 (comment) If you confirm the intructions to import the dash are ok, @alexjustesen will publish it in the official docs of the project. Let us know.
|

Beta Was this translation helpful? Give feedback.
-
This requires you to install Grafana eh? Is there anyway to simply use Influx? without adding more to it? I am very new to all this and its kind of complex :) |
Beta Was this translation helpful? Give feedback.
-
|
not sure why it closed it. |
Beta Was this translation helpful? Give feedback.
-
|
You can reopen it...can't you?
How do you want to display the graphs? Grafana does that. You need a tool. Maybe in the future @alexjustesen can implement some graphs in the dashboard, but since there's influx, I wanted to see data immediately. Grafana is simple...check some guides on youtube...once you have it installed, just follow the procedure above to import my dashboard. |
Beta Was this translation helpful? Give feedback.
-
|
@alexdelprete I will try, I am very very new to all of this. For years ive been a DBA (But Cli based stuff that IMHO seems simple) All of these GUI/Point and click things seem to be confusing to me, because it basically just does whatever vs having you set it up. so you really dont learn much. If you feel like helping me :) I have Skype and such. :) |
Beta Was this translation helpful? Give feedback.
-
|
@rhcp011235 thanks for using Speedtest Tracker! I too used to be a dba, then did a bit of analytics work but during that was always a web developer so this project feels like home. |
Beta Was this translation helpful? Give feedback.
-
|
@alexjustesen Thank you! I bet it does for you, I never got into any web dev nor dealt with graphics. Ive always been behind the scenes doing actual DB work and Data mining and Data warehouse type stuff. so this is all like Korean to me :) |
Beta Was this translation helpful? Give feedback.
-
After a couple of years of development, for years I've done system & network management, then project management, then presales and Sales. A little bit of everything. :)
Oh that is not correct. I'm playing with Grafana since 3-4 months...you really need to understand databases, queries, etc. You would be very good with Grafana. Usually I suck with UI/GUI stuff...but Grafana is pretty good on that side once you understand data, where it is, and what you want to correlate and present. Install it and play with it (with my dashboard for example), with your kind of experience, I'm sure you'll like it. You start with something and customize it, to learn how to use it. Try it. |
Beta Was this translation helpful? Give feedback.
-
|
Got it working :) Thank you @alexjustesen @alexdelprete |
Beta Was this translation helpful? Give feedback.
-
|
closed |
Beta Was this translation helpful? Give feedback.
-
I told you it was easier than you thought. :) So the steps of the procedure work? Can we publish them in the official docs? |
Beta Was this translation helpful? Give feedback.
-
Semi. I had to modify the queries because I named my bucket Speedtest-tracker. Other than that? It was very simple |
Beta Was this translation helpful? Give feedback.
-
You can rename a bucket in InfluxDB v2. I will add that to the procedure in case the user has already created the bucket.
|

Beta Was this translation helpful? Give feedback.
-
|
Hey, Here is Gist for it https://gist.github.com/PovilasID/113c5d2ef6fc9fbddcd19864466399a6 |

Beta Was this translation helpful? Give feedback.
-
Thanks. I applied the variable to the panels and uploade v2 to grafana dashboards.
If somebody could test the import (to make sure latest revision is used) and report back it would be very helpful. Thanks in advance. |

Beta Was this translation helpful? Give feedback.
-
I tested dash id |
Beta Was this translation helpful? Give feedback.
-
|
Thanks a lot for the help. Do you have multiple speedtest servers configured? Because the dash wasn't working properly in those cases. I fixed it. |
Beta Was this translation helpful? Give feedback.
-
Not entire sure... a) Not all testing servers get passed to my influxdb instance because of #301 so I have only a couple of records. b) They are from different servers and all the charts look populated... so it looks like it is fixed but I can not validate 100% |
Beta Was this translation helpful? Give feedback.
-
|
I updated the latest version with some bar charts: https://gist.github.com/PovilasID/113c5d2ef6fc9fbddcd19864466399a6 |

Beta Was this translation helpful? Give feedback.
-
|
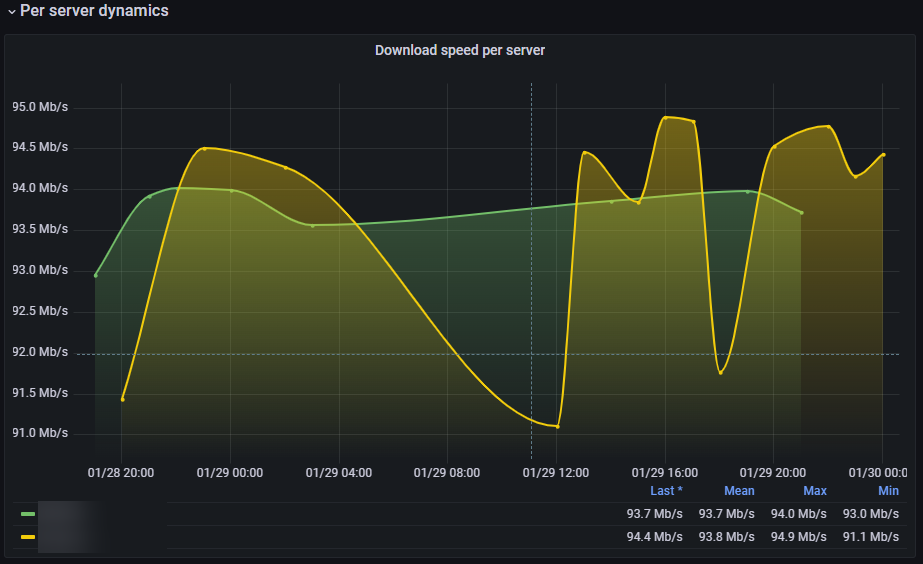
I also added a row with 4 charts displaying per server dynamics of download upload speeds and ping and jitter dynamics. I also enabled shared crosshair to enabled shared crosshair. |
Beta Was this translation helpful? Give feedback.
-
|
Also added a server selector for per server results comparison |
Beta Was this translation helpful? Give feedback.
-
|
Where did you put those bars exactly? A larger screenshot would help. :) |
Beta Was this translation helpful? Give feedback.
-
|
I added the bars the cells in the table at the top displaying averages |
Beta Was this translation helpful? Give feedback.
-
|
Does the InfluxDB feature replace the default DB used by Speedtest Tracker, or is the InfluxDB just a sink, that may or may not work and won't interfere with regular Speedtest Tracker work? |
Beta Was this translation helpful? Give feedback.
-
InfluxDB is an added as an optional additional data exporting feature. When ST executes a test, the internal db is updated and if you've configured Influxdb, data is also written there. |
Beta Was this translation helpful? Give feedback.
-
|
@alexdelprete thanks for the dash and the documentation on it. I was able to get it to work, however, some of the "latest" tiles are empty. Is there anything else to be configured for this data?
|

Beta Was this translation helpful? Give feedback.
Uh oh!
There was an error while loading. Please reload this page.
-
Hello.
I have this running on my Unraid Instance and it has been great, I finally got around to getting it hooked into InfluxDB2 about a week or so ago.
I saw some people with grafana library in InfluxDB getting a Nice graph working and I am not too keen on influxDB.
I know more Oracle/DB2/Mysql type stuff.
Any help on getting a nice dashboard in Influx would be helpful to everyone :)
Thank you
Beta Was this translation helpful? Give feedback.
All reactions