A D3.js based javascript library for interactive map visualizations and animations
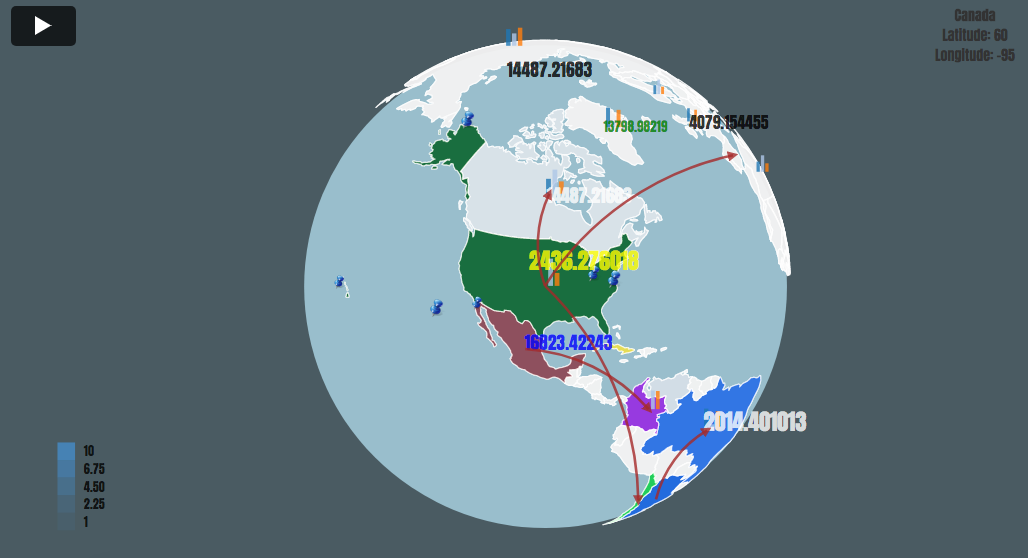
WorldMap.js is a javascript library based on D3.js to visualize json data or spreadsheets on a map by plotting graphs, markers, text, images, arcs and bubbles. It also has some basic GIS functionality such as loading and drawing objects in Geojson format.
The library is fully customisable allowing you to set almost all the styles of the map. You can customize the map style, the objects on the map and the animations by setting custom values into the Worldmap object. You can also choose which data you want to display by selecting specific columns or attributes in the table panel.
You can choose from more than 26 projections and 30 countries, and select your data sources form a csv and json file a javascript variable or a table.
To use the library and the plugins you will need to load the stylesheet file and the javascript file into your website or computer. You will also have to load the following dependencies.
For more examples be sure to visit: WorldMapjs.org
For WorldMap.js to function properly you will have to set the following dependencies.
 <!-- Latest compiled and minified CSS -->
<link rel="stylesheet" href="https://maxcdn.bootstrapcdn.com/bootstrap/3.3.7/css/bootstrap.min.css">
<link rel="stylesheet" type="text/css" href="https://cdn.datatables.net/1.10.15/css/jquery.dataTables.min.css">

<!-- Latest compiled JavaScript -->
<script src="https://code.jquery.com/jquery-3.2.1.min.js"></script>
<script src="https://maxcdn.bootstrapcdn.com/bootstrap/3.3.7/js/bootstrap.min.js"></script>
<script src="https://cdn.datatables.net/1.10.15/js/jquery.dataTables.min.js"></script>
<script src="https://d3js.org/d3.v3.min.js"></script>
<script src="//d3js.org/topojson.v1.min.js"></script>
<script src="//d3js.org/d3.geo.projection.v0.min.js"></script>
 <script src="//d3js.org/queue.v1.min.js"></script>
For a correct load, you should put the javascript file right before the body tag and the WorldMap object.
<div id="mapcontainer" align="center"> <!-- You can place the container wherever you want, but it has to be above the worldmap.js files-->
<link rel="stylesheet" href="css/worldmap.v1.css">
<script src="js/worldmap.v1.js"></script>
<script>
var createmap = new Worldmap({
    elementid: "#mapcontainer",
   });
   </body>
To customize the style the plugins and the data in the visualisation you will have to set one of the following parameters when creating the Worldmap object.
var defaultsettings = {
    elementid: "body",  // html container of the map
    width: $( window ).width(),  // The size of the map, default is window size
    height: $( window ).height(),
    mapstyle: {  // To syle the map
        ocean: "#4A5B62",
        region: "#F3F3F3",
        border : "#ffffff"
    },
    project: {  // Proyection and zoom configurations
        name: "Mercator",
        zoomlevel: 1,
        zoomarea:false,
        center: [38,-97]
    },
    dataType: false, // Type of data (csv or json)
    dataurl: false, // location of the csv or json file
    data: [], // The data
    plugin: false, // The plugin (cloropleth, bubbles, pulse, arcs, text, images, barchart)
    keys: ["default","Data","color","size"],
    graticule: 'false', // show graticule
    editpanel: 'true', // show edit
    showtable: 'true', // show table
    animate: 'false',
    delay: 500,
    animduration: 1000,
    colorscale: d3.scale.category20(),
    defaultfill: "#4682B4", // default color for the objects
    defaultsize: 30, // default size for the objects
    font: {  // font style for the text
        family: 'ANTON',
        color: false,
        size : false
    },
    image: { // image url and size
        url: 'https://cdn3.iconfinder.com/data/icons/softwaredemo/PNG/24x24/DrawingPin1_Blue.png',
        width: 30,
        height : 30
    },
    antartica:false, // show antartica
    zoomable:true, // allow zooming
    shownames:false, // show country/region names
    region:false, // Select the country in 2 letter code
    player:false // show player

    }
    ```