- Prometheus runs on port:
9090, Access promotheus using this url: http://:9090/targets - Grafana runs on port:
3000to access grafana.use this url - http://:3000/?orgId=1 - Grafana first time setup:
- Login using
admin/adminor you can alternatively click on skip - Create DataSource as follows:
- Name - Enter a name that represents the prometheus data source. Example -
lattice-prometheus - Type - Select Prometheus from the dropdown.
- URL - This is the service discovery endpoint against prometheus port. Example -
http://web.default.svc.cluster.local:9090. Note - Service discovery endpoint can be found under cluster and prometheus configured port is9090 - Access - This should be selected as Server(Default)
- Skip other prompts, scroll down and click on Save & Test. This will add the datasource and grafana should confirm that prometheus data source is accessible
- Name - Enter a name that represents the prometheus data source. Example -
- Add dashboard as follows:
- On the left hand panel, click on + symbol and select the option - Import
- Select the option Upload .json File. Select the file -
envoy_grafana.jsonfrom the pathvoting-app/samples/preview/apps/voteapp/metrics/ - Select the prometheus-db source from the dropdown. This as per above example should be
lattice-prometheus - Select Import and the envoy-grafana dashboard will be imported
- Scripts to generate traffic ( voting-app/samples/preview/apps/voteapp/metrics/traffic/): Run results-cron.sh will ping /results service every 3 seconds Run vote-cron.sh to will trigger /vote service
- Login using
Stats Exporter
- Stats_Exporter has been implemented as a workaround to transform "|" separators that the Envoy/AppMesh emits into "_" .
- This is important because Prometheus can parse metrics that have only "_".
- Stats_Exporter is a spring boot application and added as a side-car to the votes-webapp.
- It captures the metrics from /stats/prometheus and has a cron-run.sh to curl envoy port at 9901/stats/Prometheus, transforms and writes to a static file.
- The statis file is then made available for the scrape job in Prometheus at port 9099 to capture the transformed metrics.
- These metrics are then used for Prometheus and Grafana to build dashboards.
There are four collapsible panels:
- Server Statistics (global)
 Server related information can be obtained from a combination of metrics specific to either 'envoy_cluster_membership_xx' or 'envoy_server_xx'
-
Live Servers: sum(envoy_server_live)
-
Cluster State: (sum(envoy_cluster_membership_total)-sum(envoy_cluster_membership_healthy)) == bool 0
-
Unhealthy Clusters: (sum(envoy_cluster_membership_healthy) - sum(envoy_cluster_membership_total))
-
Avg uptime per node: avg(envoy_server_uptime)
-
Allocated Memory: sum(envoy_server_memory_allocated)
-
Heap Size: sum(envoy_server_memory_heap_size)
-
Request/Response Summary (can be viewed by Service)
Metrics under this section take envoy_cluster_name input and host from grafana template variables - which are named as service and host
-
Total Requests: sum(envoy_cluster_external_upstream_rq_completed{envoy_cluster_name=
"$cluster",host="$hosts"}) -
Response - 2xx: sum(envoy_cluster_external_upstream_rq{envoy_cluster_name=
"$cluster",host="$hosts",envoy_response_code="200"}) -
Success Rate (non 5xx): 1 - (1 - (sum(envoy_cluster_external_upstream_rq{envoy_cluster_name=
"$cluster",host="$hosts",envoy_response_code="200"})/sum(envoy_cluster_external_upstream_rq{envoy_cluster_name="$cluster",host="$hosts",envoy_response_code=~".*"}))) -
Response - 3xx: sum(envoy_cluster_external_upstream_rq{envoy_cluster_name=
"$cluster",host="$hosts",envoy_response_code=~"3.*"}) -
Response - 4xx: sum(envoy_cluster_external_upstream_rq{envoy_cluster_name=
"$cluster",host="$hosts",envoy_response_code=~"4.*"}) -
Response - 5xx: sum(envoy_cluster_external_upstream_rq{envoy_cluster_name=
"$cluster",host="$hosts",envoy_response_code=~"5.*"}) -
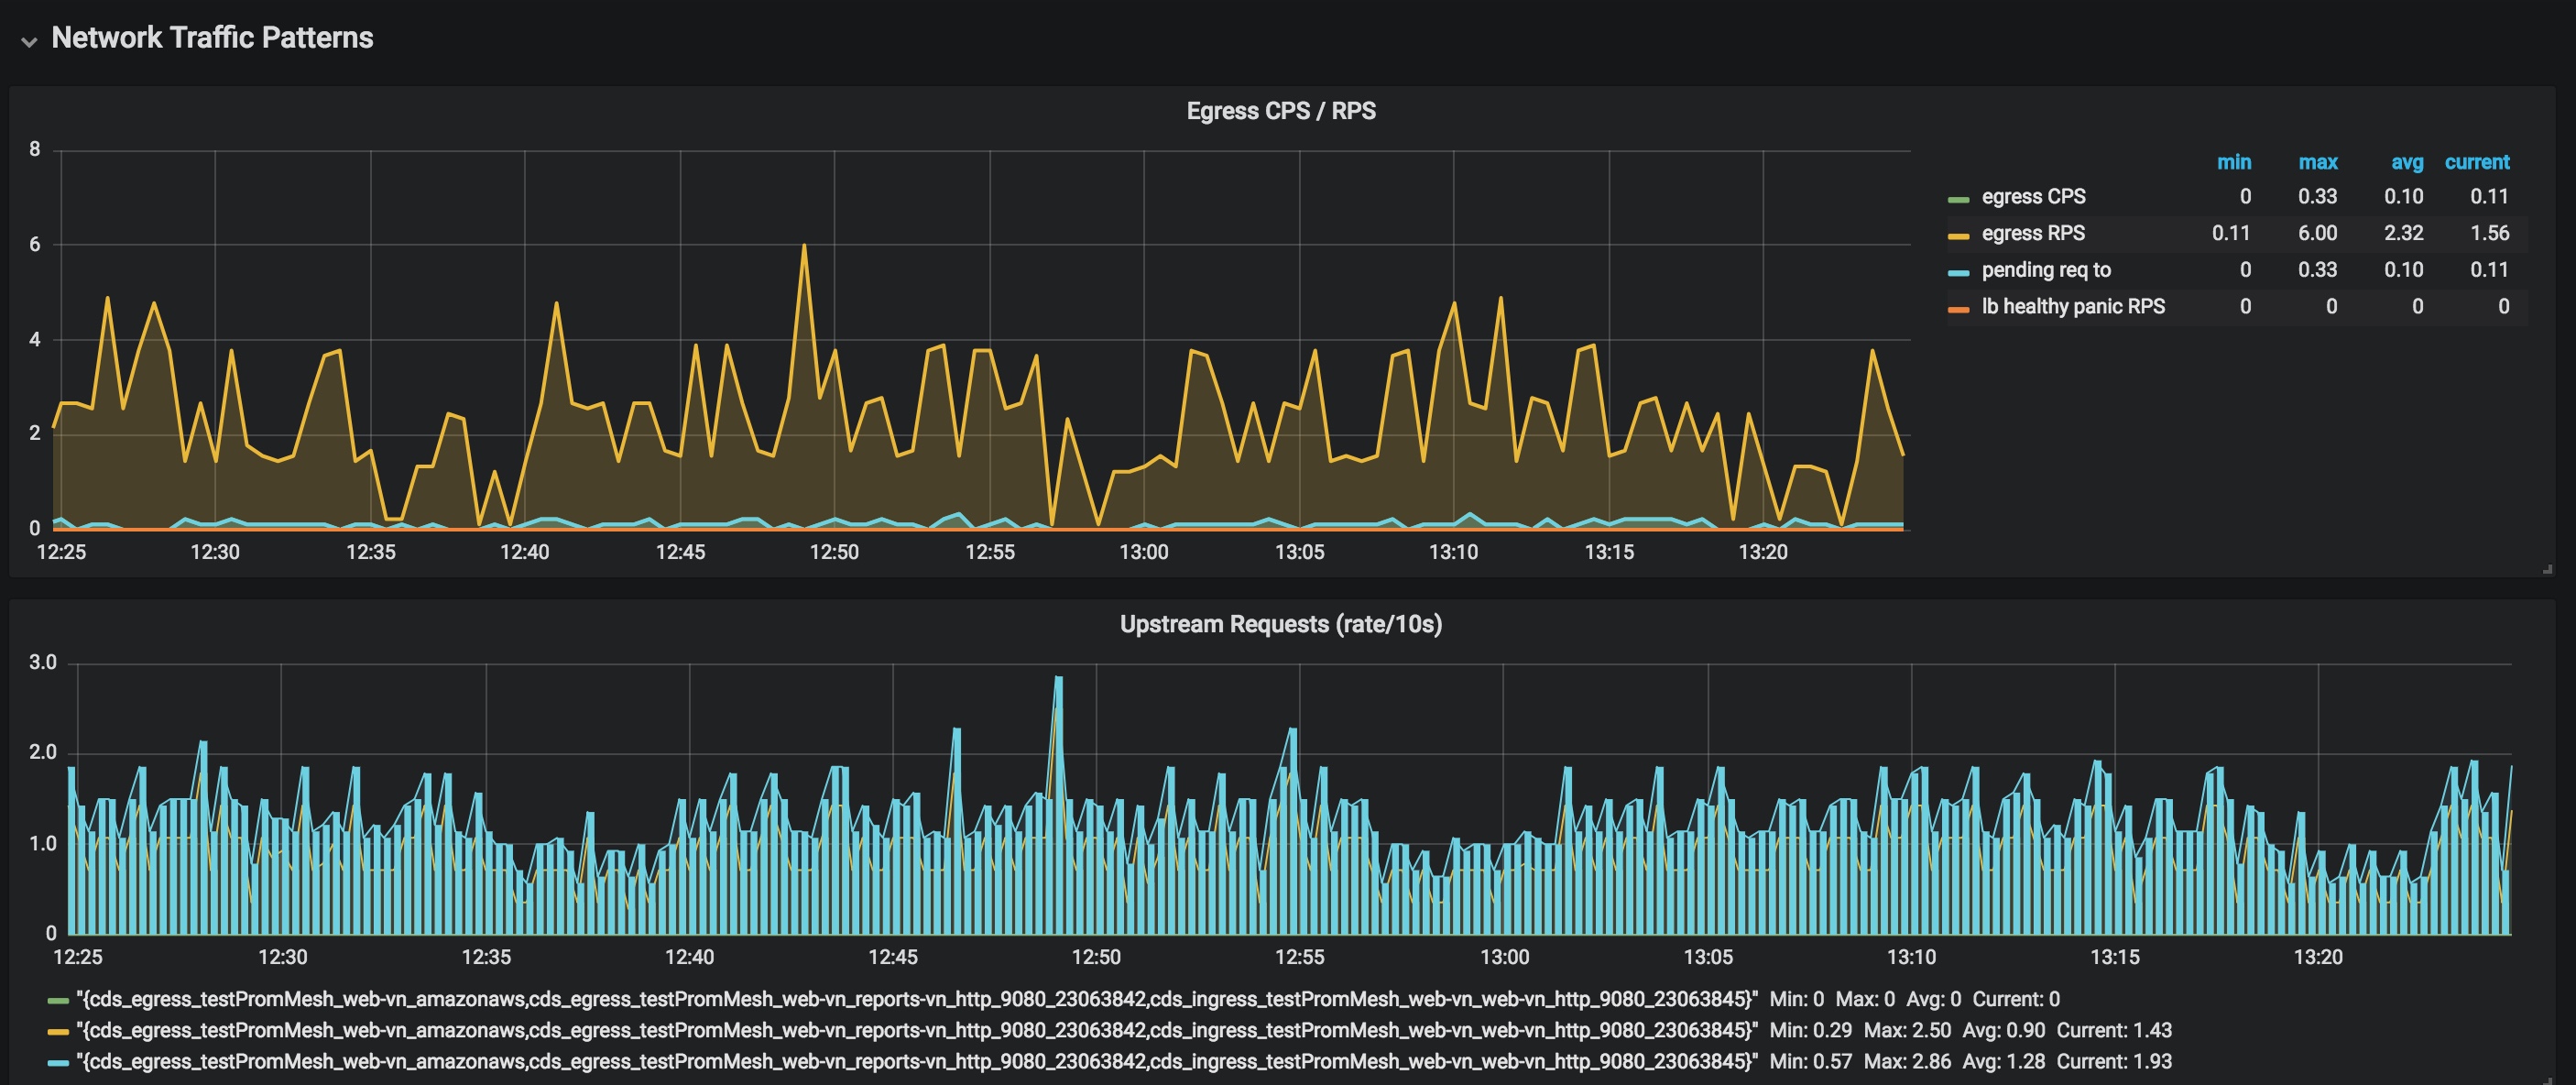
Network Traffic Patterns (Upstream: by service, DownStream: Global)
-
Egress CPS/RPS - The graph depicts information related to total upstream connection sent vs total upstream connections received vs total upstream pending connections vs cluster lb health. The four specific metrics used are:
- egress CPS: sum(rate(envoy_cluster_upstream_cx_total{envoy_cluster_name=~"$cluster"}[10s]))
- egress RPS: sum(rate(envoy_cluster_upstream_rq_total{envoy_cluster_name=~"$cluster"}[10s]))
- pending req to: sum(rate(envoy_cluster_upstream_rq_pending_total{envoy_cluster_name=~"$cluster"}[10s]))
- lb healthy panic RPS: sum(rate(envoy_cluster_lb_healthy_panic{envoy_cluster_name=~"$cluster"}[10s]))
-
Upstream Received Requests (rate/10s): rate(envoy_cluster_upstream_rq_total{envoy_cluster_name=
"$cluster",host="$hosts"}[10s]) -
Upstream Connection Summary: sum(envoy_cluster_upstream_cx_active{envoy_cluster_name=~"$cluster"})
-
Global Downstream Requests: sum(rate(envoy_http_downstream_rq_total[10s]))
-
Network Traffic Details in Bytes ((Upstream: by service, DownStream: Global)
- Upstream -Sent: sum(envoy_cluster_upstream_cx_tx_bytes_total{envoy_cluster_name=~"$cluster"})
- Upstream - Sent Buffered: sum(envoy_cluster_upstream_cx_tx_bytes_buffered{envoy_cluster_name=~"$cluster"})
- Upstream - Received: sum(envoy_cluster_upstream_cx_rx_bytes_total{envoy_cluster_name=~"$cluster"})
- Upstream - Received Buffered: sum(envoy_cluster_upstream_cx_rx_bytes_buffered{envoy_cluster_name=~"$cluster"})
- Downstream Global - Sent: sum(envoy_http_downstream_cx_tx_bytes_total)
- Downstream Global - Sent Buffered: sum(envoy_http_downstream_cx_tx_bytes_buffered)
- Downstream Global - Received: sum(envoy_http_downstream_cx_rx_bytes_total)
- Downstream Global - Received Buffered: sum(envoy_http_downstream_cx_rx_bytes_buffered)
- Upstream Network Traffic (bytes): Represents the upstream network traffic at 10s rate based on - irate(envoy_cluster_upstream_cx_rx_bytes_total{envoy_cluster_name=
"$cluster",host="$hosts"}[10s]) - Downstream Network Traffic (bytes): Represents the downstream network traffic at 10s rate based on -irate(envoy_http_downstream_cx_rx_bytes_total{}[10s])


