-
Notifications
You must be signed in to change notification settings - Fork 8
New issue
Have a question about this project? Sign up for a free GitHub account to open an issue and contact its maintainers and the community.
By clicking “Sign up for GitHub”, you agree to our terms of service and privacy statement. We’ll occasionally send you account related emails.
Already on GitHub? Sign in to your account
How to reduce memory usage? #20
Comments
|
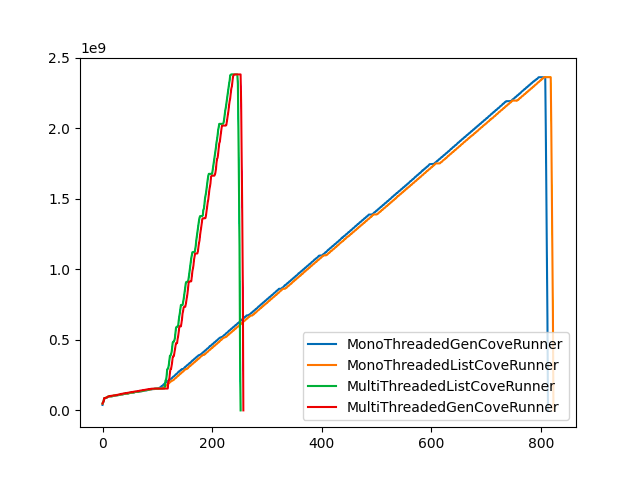
TLDR: Sessions aren't threadsafe. I don't know enough about Python to say why, but I think sharing the boto3 sessions across threads is causing the leak.
I measured the memory use of various implementations of CoveRunner in a version of botocove that I modified for testing (see #23 for the ideas that lead to this). The chart below shows memory use over time to list the IAM users in an organization of 500 member accounts. The X axis shows memory use in gigabytes. The Y axis shows elapsed quarters of a second. The MultiThreadedListCoveRunner is the original implementation. The MultiThreadedGenCoveRunner uses a generator instead of a list to return results. Over the long term, each implementation uses the same amount of memory: 2.5GB. The MonoThreaded versions of these take longer, but use the same amount of memory. The amount of memory used scales linearly with the number of queried accounts. If you want to know more about how this was set up, check the README and the testing_botocove.md in my memory_profiling branch: https://github.com/iainelder/botocove/tree/memory_profiling/profiling (It doesn't necessarily make much sense to anyone other than me 😅) Before I got around to also rewriting the CoveSessions class as a generator, I learned that memory leaks in boto are a common ocurrence. We're in good company at least!
These issues were addressed recently by better boto3 documentation for threading: To cut to the chase: Sessions aren't threadsafe. I don't know enough about Python to say why, but I think sharing the boto3 sessions across threads is causing the leak. From the latest Session documentation:
Thanks to @swetashre's sample code for profiling boto3 which I adapted for this investigation. |
|
This is super interesting, thanks - great notes. Interestingly from that writeup, I think we are handling Sessions in a safe manner (they're not shared across threads - we cut a new session for each thread), but instantiation of a Session just eats a chunk of memory and we do a lot of that - this issue was the one that felt closest to what we're seeing? boto/boto3#1670 Either way, might be worth calling out in the readme that botocove's memory requirements scale linearly with number of targets and provisioning an ec2 instance might be a requriement for hitting 5k accounts at once 😅 |
|
I wonder if #23 might still have a solution here: if I'm understanding the problem correctly (we use a Session per thread which is memory-safe but expensive as each instance isn't cleaned up until the script finishes), a generator or context manager might allow cleanup during execution to release memory? One reason I refactored the codebase to just use threadpools over async.io was the opportunity to have a single thread do the whole task, rather than "batch get all the sessions -> resolve all threads", "batch do all the sessions -> resolve threads", we could have a threadpool that does lots of "get a session, assume a role, do the work, finish" - I was initially thinking about this to take the pressure off the sts assume role and describe account limits you saw previously. I wonder if we could do something like a) see if a Boto3 session can be used as Just top of mind after reading your excellent research, may be entirely up the wrong tree :) |
In the current implementation, each session isn't scoped to a single thread. The session-starting thread returns each session to the main thread. The session is later picked up by the function-running thread. So each session is shared among three threads. I think that sharing causes the memory leak. In my mono-threaded implementation the memory consumption is the same. Here the main thread is also the function-running thread. So each session is shared among two threads, and there is still a memory leak.
I think this is worth exploring. In fact, I already put together a prototype script that rearranges the existing parts to use a single thread pool that keeps the session scoped to the worker thread as you describe. Instead of iterating over sessions, the worker thread iterates over account IDs. See the main method in the hopefully-named thread_safe_demo.py for what I imagine the body of the decorator would look like. https://github.com/iainelder/botocove/blob/91740738567e8b869aabb2e7b8629abf03d3e080/thread_safe_demo.py It works on my personal org just like the current decorator, except that tqdm paints only one progress bar (See below for example output.) The next step is to run another experiment with the two decorator implementations side by side to see how the memory consumption compares. |
|
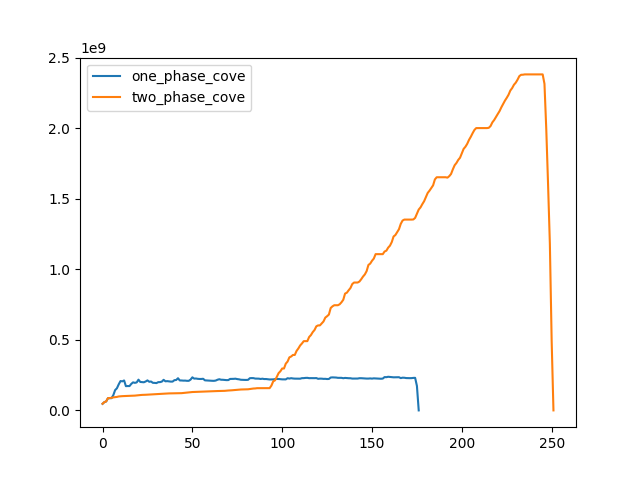
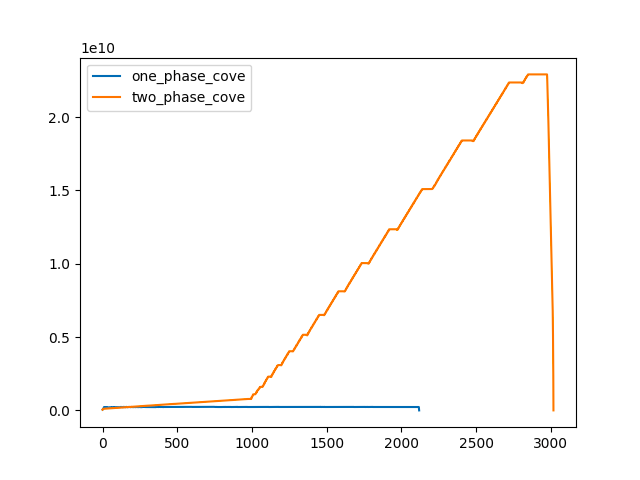
I set up a new experiment to compare the current decorator implementation and the "thread-safe" version I described above. See compare_decorators.py for the implementation. The experiment refers to the current implementation as It refers to the thread-safe version as It looks like we might be on to something with the one-phase version. This plot records memory use across an organization of 500 member accounts, run on an r6g.large. This plot records memory use across an organization of 5000 (!) member accounts, run on an r6g.4xlarge.
|
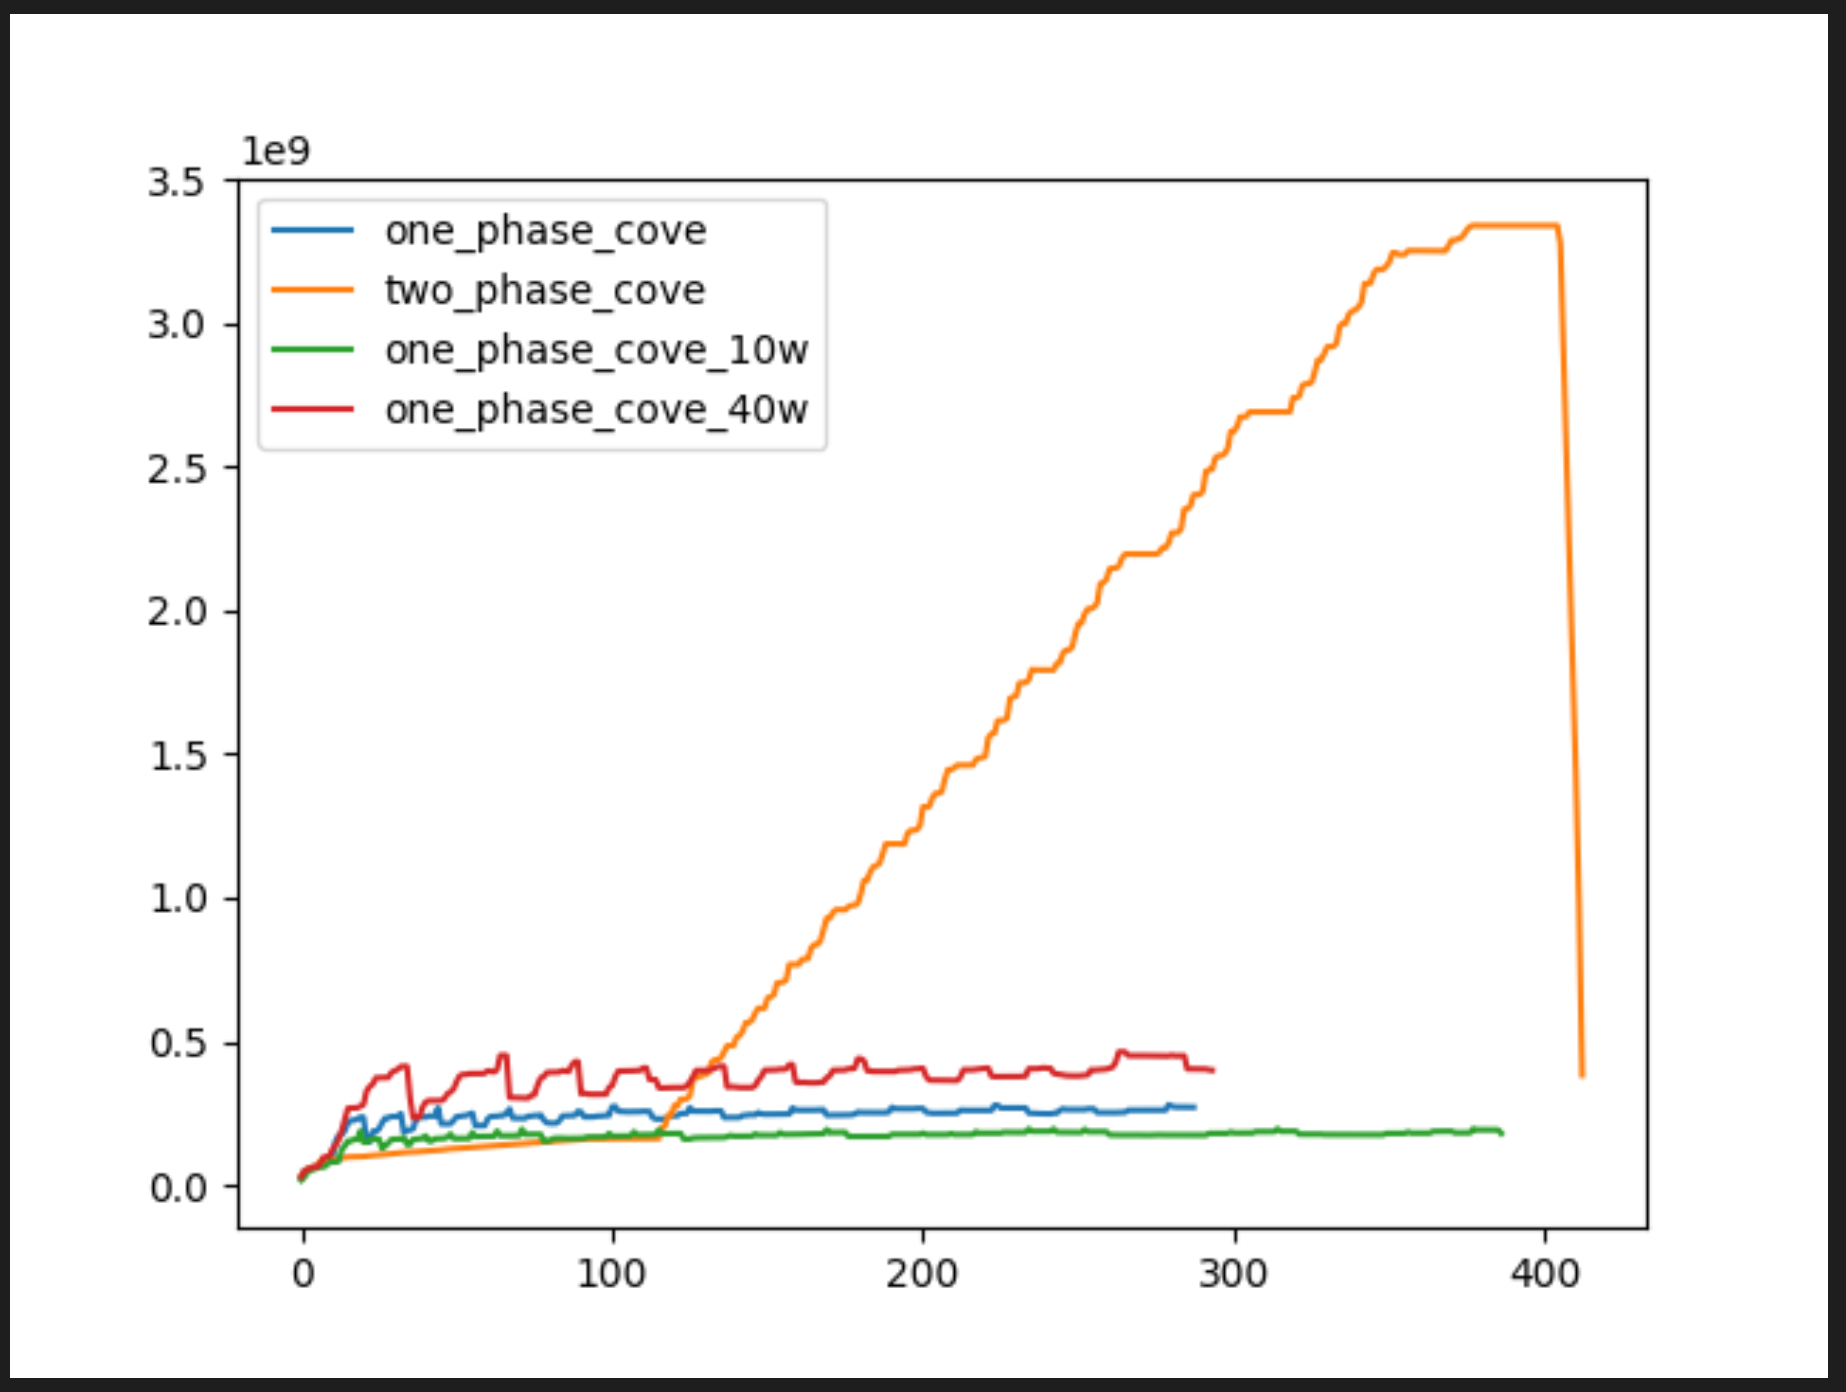
I'm relatively confident that this isn't the case: the problem is that we instantiate (for Slightly pedantic, but I'd suggest botocove is causing the leaky behaviour here, rather than boto3, and the implementation in threading rather than issues of thread-safety in implementation cause it. This tallies with your awesome A quick hack on your testing (altering the threadworkers value to 10 and 40) seems to bear this theory out (and also as an interesting side effect help profile the optimum number of workers for memory pressure on my 13" Intel MBP with 16gb ram - I did see a few rate limit exceptions get swallowed in the logs though so this probably isn't the purest of tests, I think it's valid for our case though): Exciting stuff! I'll get a PR up if you'd like to collab on implementing the refactor to 1-phase: seems prudent to expose a threadworker variable too now. |
I think that's what I was trying to say :-) I'm not confident that I understand why the two-phase implementation leaks memory, so I want to check my understanding here. Is the garbage collector impeded by the fact that the sessions are in the scope of the main decorator, and so are not collected until the decorator returns?
And does the lazy loading mean that the sessions occupy less memory at the start than when a client is instantiated? That would explain the two gradients of the two-phase plot. In any case, it's this lack of confidence and knowledge that lead me to to test it experimentally. We don't need to be intimate with Python's garbage collector when we can show improvements using the plots :-)
Yes, I think we can ignore generators for now. My first investigation explored the generator idea because I thought that building a list of results was responsible for the incremental memory growth. The first plot disproved that because the generator version uses the same amount of memory. If each session occupies 20MB, then I think the amount of memory used to store the results is negligible. I imagine the result from each account would be a few hundred K at most.
From your chart I understand thaty 40 worker threads seem to take slightly longer than 20 threads and the memory consumption is more spiky (although it's hard to tell when the plots are dwarfed by the two-phase plot). Why do you think that is?
Yes, I'd love to help. I'll check out #24 when I have time over the next week. |
Long story short there's a point where diminishing returns kick in and make more threads less efficient, partly with how threads work (1 process switching contexts) and partly with resource constraints. 20 workers is a bit of a finger in the air guess from basic initial testing - there's an optimal number for each machine but realistically most of the tuning is around at what point we annoy AWS api rate limits: boto3 is mostly I/O bound, at some point the number of threads saturate either local capacity (bandwith, NIC, cpu process, memory, etc), or AWS rate limits start throttling/retrying as built in to boto3 and it takes more work to clear a batch of work from the threadpool. More concurrent threads also just means more instantiated sessions/memory pressure. It's nice to be able to prove that out though, and I'm keen to bundle your profiling work somehow to provide the ability to let people tune that number if they feel the need :) |
I've started a new branch from this one to properly integrate the profiler. So far it has a context manager for patching CoveHostAccount. I'll pull in the good bits of compare_decorators.py. You can compare the branches here: |
|
I've rewritten the profiling code based on your new branch in #24. You can generate a plot like this: By default it simulates an organization with 100 member accounts. It looks like your single threadpool version fixes the memory problem :-) On my machine the memory is now proportial to the number of threads rather the number of accounts. It seems like the sweet spot for threads for me right now is around 16-20 threads. |
|
Fixed in 1.5.0 - #24 |
|
Awesome! Looking forward to using it. |
|
@connelldave , thanks for fixing this so quickly after we identified a solution. I don't have to run botocove on an EC2 any more for the bigger jobs. That really speeds up my workflow so that I can spend more time analyzing the collected data. I owe you one: 🍻 |


When I run botocove in an interactive session, or when I run it as part of aws-org-inventory, and query a sufficiently large organization, the process consumes so much memory so as to destabilize the operating system. (Ubuntu gets ugly when it runs out of memory.)
It appears that the amount of memory required is proportional to the number of accounts in the organization.
I haven't had time to study it carefully, but today I did watch the system activity monitor while running aws-org-inventory across a large organization (around 1000 accounts).
The memory consumption started in the low MBs, which is normal for Python, and increased steadily as it queried each account. When it finally completed processing, it had consumed 4GB of memory. (The thing is that my work machine has only 8GB of memory 😅 )
Is there a different programming technique I should use as a client to avoid this?
Or can something be changed in the library, such as using a generator to yield results instead of collecting a huge object?
The text was updated successfully, but these errors were encountered: