Skip to content
New issue

Have a question about this project? Sign up for a free GitHub account to open an issue and contact its maintainers and the community.

By clicking “Sign up for GitHub”, you agree to our terms of service and privacy statement. We’ll occasionally send you account related emails.

Already on GitHub? Sign in to your account

Area chart should show maximum value as well when hovering over the top of the chart #10803

Closed
tommikiviniemi-srs opened this issue Mar 20, 2017 · 2 comments
Labels
Feature:Visualizations Generic visualization features (in case no more specific feature label is available) release_note:enhancement Team:Visualizations Visualization editors, elastic-charts and infrastructure

Comments

@tommikiviniemi-srs
Copy link

tommikiviniemi-srs commented Mar 20, 2017

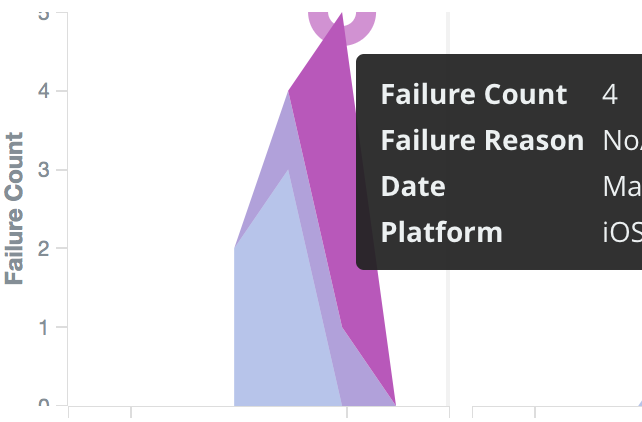
Feature request: Area chart should show maximum value as well, when hovering over the top of the chart.

Right now there is no way of seeing the total value when hovering over a section of an area. Please see the following image where an area chart shows failure reasons:
Image

In addition to the relative amount of different errors we are very interested in seeing if the error RATE itself increases (and by how much). To do this we'd have to create an additional (line) chart. It'd be convenient if, for example, hovering over the top "node" in the area chart (as I do in the screenshot) displayed the total number as well.

Related: #10804

@tbragin tbragin added Feature:Visualizations Generic visualization features (in case no more specific feature label is available) release_note:enhancement labels Mar 22, 2017
@tommikiviniemi-srs
Copy link
Author

And just to clarify, you get some kind of picture of this by looking at the y-axis, but if there's lots of values you can't see the exact value this way, which forces us to duplicate charts.

@timroes timroes added the Team:Visualizations Visualization editors, elastic-charts and infrastructure label Sep 16, 2018
@stratoula
Copy link
Contributor

Closing in favor of #106024

Sign up for free to join this conversation on GitHub. Already have an account? Sign in to comment
Labels
Feature:Visualizations Generic visualization features (in case no more specific feature label is available) release_note:enhancement Team:Visualizations Visualization editors, elastic-charts and infrastructure
Projects
None yet
Development

No branches or pull requests

4 participants