-
Notifications
You must be signed in to change notification settings - Fork 8.3k
New issue
Have a question about this project? Sign up for a free GitHub account to open an issue and contact its maintainers and the community.
By clicking “Sign up for GitHub”, you agree to our terms of service and privacy statement. We’ll occasionally send you account related emails.
Already on GitHub? Sign in to your account
[Dashboard] memory leak, some jQuery Object, Promise objects cannot be GC after refresh #8455
Labels
bug
Fixes for quality problems that affect the customer experience
Feature:Dashboard
Dashboard related features
Comments
|
+1, the same issue regardless of auto-refresh. |
|
The same version of the problem |
|
+1 Any progress on this? |
|
+1 this is still happening on 5.2 |
|
I can confirm the memory leakage problem in chrome with Kibana 5.4.1 |
|
It`s the same issue: #7427 |
|
Closing as a duplicate of #7427. I know this issue was created earlier but that one has more comments in it. |
Sign up for free
to join this conversation on GitHub.
Already have an account?
Sign in to comment
Labels
bug
Fixes for quality problems that affect the customer experience
Feature:Dashboard
Dashboard related features
Kibana version:kibana-5.0.0-alpha5-linux-x86_64
Elasticsearch version:elasticsearch-5.0.0-alpha5
Server OS version:Ubuntu 14.04.5 LTS
Browser version:Version 53.0.2785.116 (64-bit)
Browser OS version:Ubuntu 14.04.5 LTS
Original install method (e.g. download page, yum, from source, etc.):dowload tar files from https://www.elastic.co
Description of the problem including expected versus actual behavior:
Expect: Newly created Objects should be GC after the next refresh;
Actual: After each refresh, there are still some objects have not been GC. This lead to memory usage keep growing.Chrome Tab will crash when keeping dashboard auto refresh;
Steps to reproduce:
1.open chrome in incognito mode
2.create a new dashboard, add a visualization
3.open chrome devtools, goto devtools's profile panel, start Record Allocation Timeline
4.set auto refresh interval to 5s, enable autorefresh
5.observing Allocation Timeline
Errors in browser console (if relevant):
Provide logs and/or server output (if relevant):
Recorded Profile:Heap-20160923T155153.heaptimeline
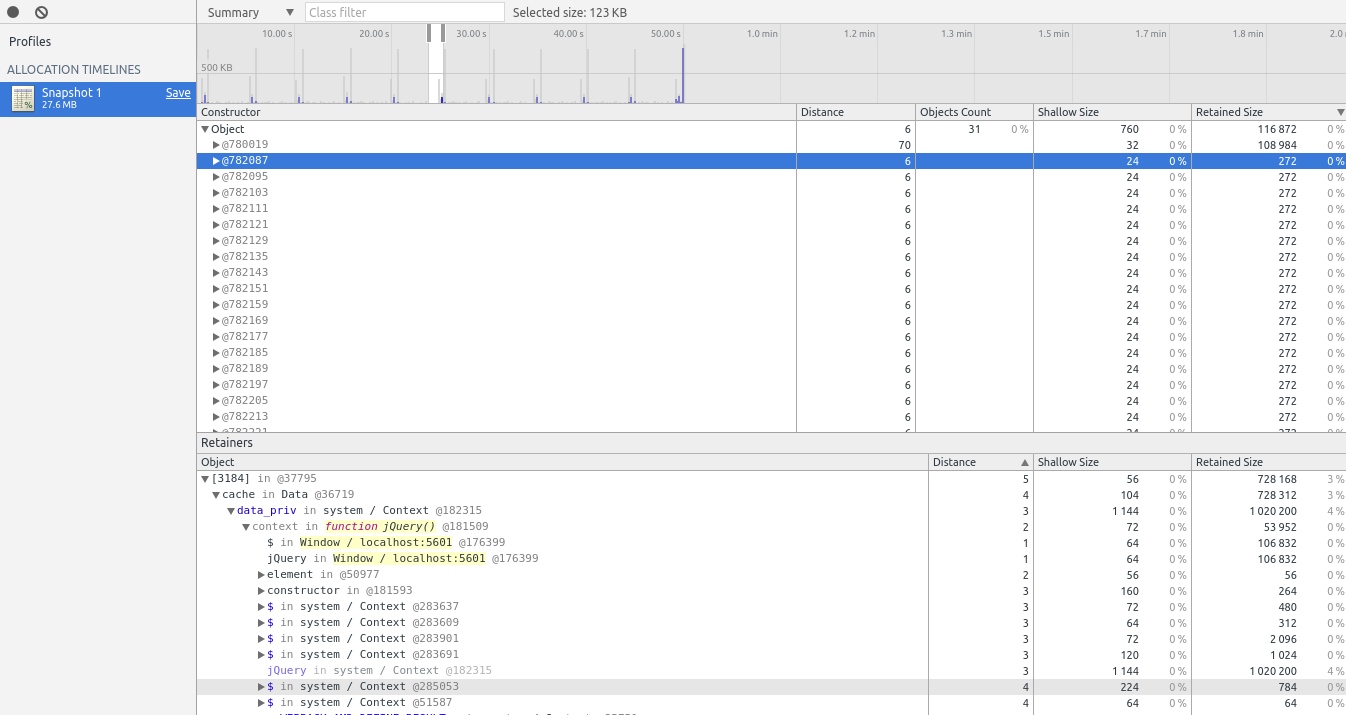
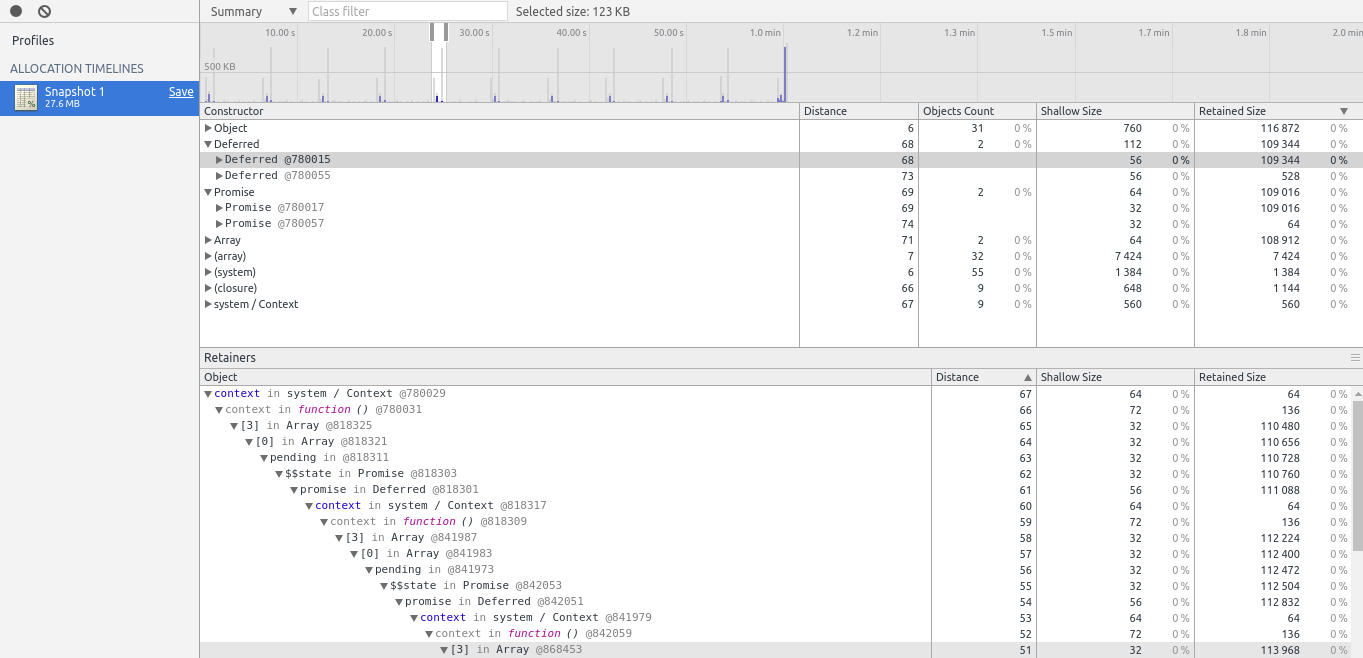
Constructor list:
A Object:

A Deferred Object:
I also tested the following kibana versions, this issue still exists.
Tested kibana versions:
kibana_4.1.11
kibana_4.2.2
kibana_4.5.4
kibana_4.6.1
The text was updated successfully, but these errors were encountered: