ClrMD is a .Net library used to collect information from a live process or a memory dump file. It's like Windbg/sos.dll, but instead of cryptic commands you get a fully object oriented API to collect and combine data.
Here is some resources to get you started:
- http://blogs.msdn.com/b/dotnet/archive/2013/05/01/net-crash-dump-and-live-process-inspection.aspx
- https://github.com/Microsoft/dotnetsamples/tree/master/Microsoft.Diagnostics.Runtime/CLRMD
The goal of this library is to provide integration with LINPad and to make ClrMD even more easy to use.
ClrMDSession will take care of the initialization of ClrMD.
int pid = Process.GetProcessesByName("HelloWorld")[0].Id;
using (DataTarget dataTarget = DataTarget.AttachToProcess(pid, 5000))
{
  string dacLocation = dataTarget.ClrVersions[0].TryGetDacLocation();
  ClrRuntime runtime = dataTarget.CreateRuntime(dacLocation);

  // ...
}
will become
using (ClrMDSession session = ClrMDSession.AttachToProcess("HelloWorld"))
{
  // ...
}
or this for a memory dump file
using (ClrMDSession session = ClrMDSession.LoadCrashDump(@"C:\Dumps\crash.dmp"))
{
  // ...
}
Note that with ClrMDSession, the mscordac is downloaded automatically from Microsoft symbol servers
if it can't be found locally.
The ClrRuntime and ClrHeap are accessible from ClrMDSession's properties.
In ClrMD, you always access object properties by its ClrType and object address.
ClrHeap heap = runtime.GetHeap();
foreach (ulong obj in heap.EnumerateObjects())
{
    ClrType type = heap.GetObjectType(obj);
    ulong size = type.GetSize(obj);
    Console.WriteLine("Address:{0} Size:{1} Type:{2}", obj, size, type.Name);
}
ClrObject is the object abstraction missing from ClrMD, it allows you to do this
foreach (ClrObject obj in session.AllObjects)
{
    Console.WriteLine("Address:{0} Size:{1} Type:{2}", obj.Address, obj.Size, obj.TypeName);
}
ClrObject implements DynamicObject, you can access instance fields like this
ulong address = 0x12345678;
ClrObject o = session.Heap.GetClrObject(address);
Console.WriteLine(o.Dynamic._someField);

//You can also use the non-dynamic way
Console.WriteLine(o["_someField"]);

// Note that the field accessor also returns a ClrObject which can be used to access other inner fields
// or to cast it into a primitive type.
If ClrObject represent a primitive value (string, byte, int, long, etc), you can directly cast it
into its primitive type.
// Print all the strings of the Heap
foreach (ClrObject obj in session.EnumerateClrObjects("System.String"))
{
    Console.WriteLine((string)obj);
}
Arrays are also handled by ClrObject.
ClrObject anArray = session.Heap.GetClrObject(0x11223344);

// You can manipulate the ClrObject like an array
if (anArray.ArrayLength > 0)
    Console.WriteLine(anArray[0]); // Print the object at index 0

// And enumerate all the items
foreach (ClrObject item in anArray)
{
    // ClrObject.GetDetailedString() will print the object address, type and fields
    Console.WriteLine(item.GetDetailedString());
}Ok, let's get to more powerful stuff.
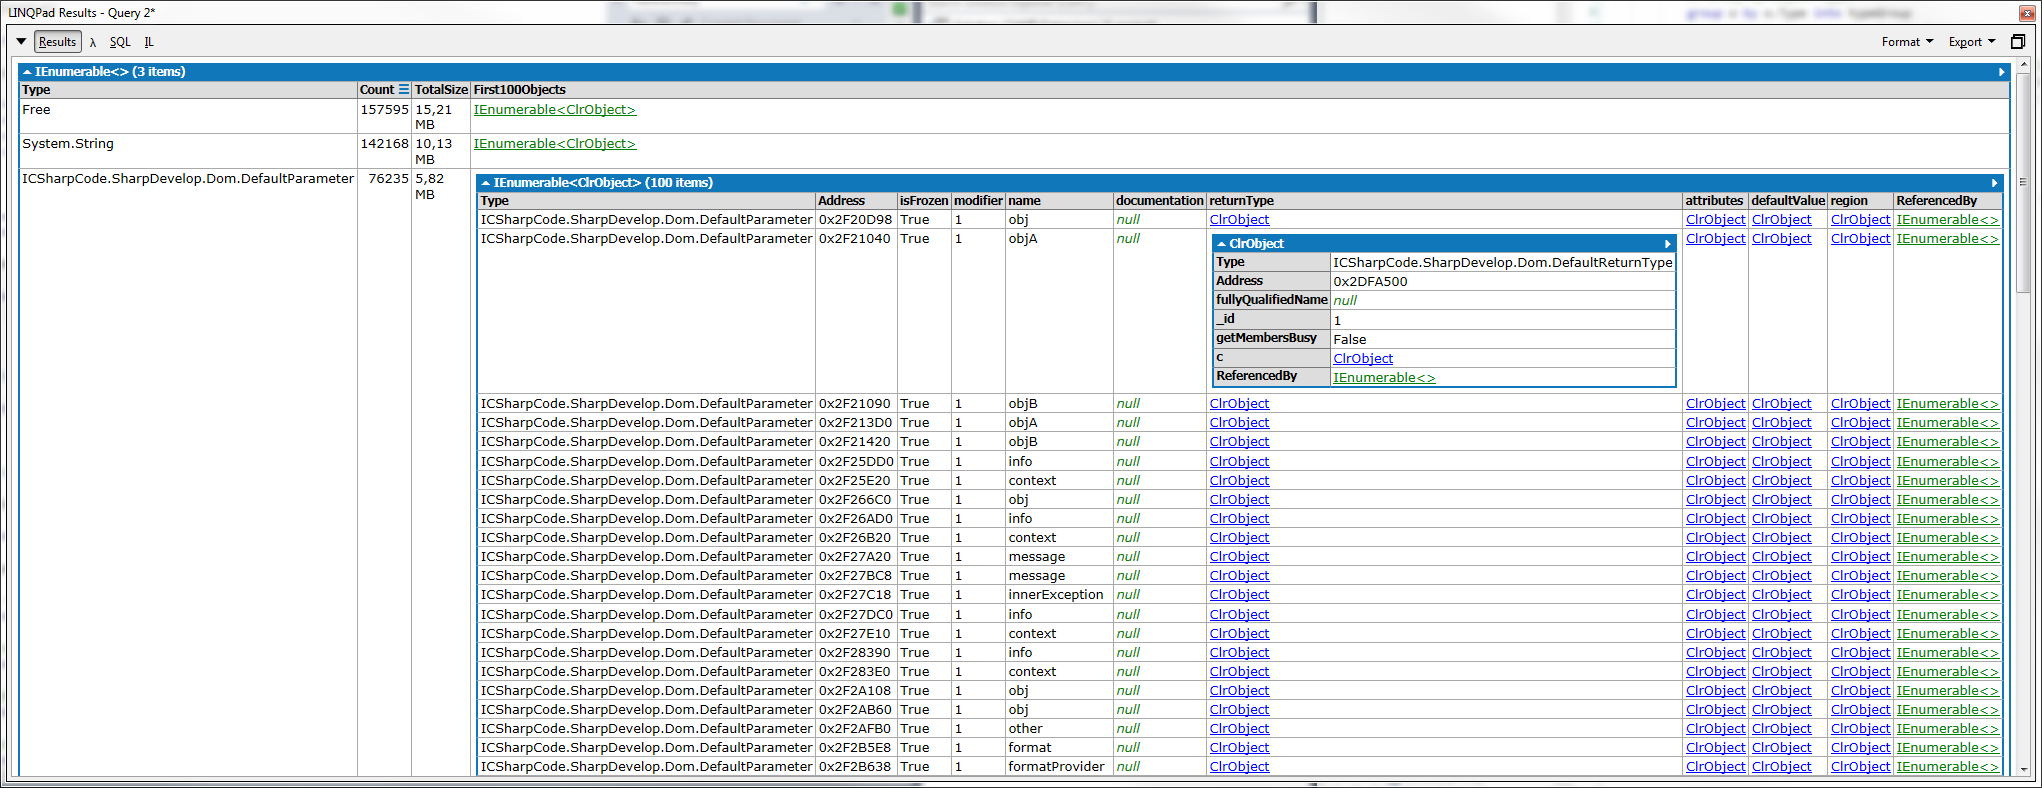
A common investigation in a memory dump is searching for memory leaks. Most memory profiler will show you the list of objects by type with instance count and total memory usage. This is exactly what we'll do in 10 lines of code!
ClrMDSession session = ClrMDSession.LoadCrashDump(@"C:\Dumps\YourDumpFile.dmp");

var stats = from o in session.AllObjects // Start with all objects
            // Group by object type.
            group o by o.Type into typeGroup
            // Get the instance count of this type.
            let count = typeGroup.Count()
            // Get the memory usage of all instances of this type
            let totalSize = typeGroup.Sum(item => (double)item.Size)
            // Orderby to get objects with most instance count first
            orderby count descending
            select new
            {
                Type = typeGroup.Key.Name,
                Count = count,
                TotalSize = (totalSize / 1024 / 1024).ToString("0.## MB"),
                // Get the first 100 instances of the type.
                First100Objects = typeGroup.Take(100),
}LINQPad is amazing with ClrMD for two reasons:
- The Result view is a nice and easy way to display objects and navigate through them.
- When you modify and re-run a query, the new code is compiled and executed in the same AppDomain it was executed before. ClrMD.Extensions leverage this by caching data in static storage, so when you run a query for the first time, it may take a bit longer to initialize all the objects, but for the next executions most operation will be instantaneous.
Here is what the Result view looks like if I run the query above:
