This datasource supports reading data from AWS IoT SiteWise and showing it in a Grafana dashboard.
- In the side menu under the Configuration link, click on Data Sources.
- Click the Add data source button.
- Select IoT SiteWise in the Industrial & IoT section.
The IoT SiteWise plugin authentication matches the standard Cloudwatch plugin system. See the grafana cloudwatch documentation for authentication options and setup.
Once authentication is configured, click "Save and Test" to verify the service is working. Once this is configured, you can specify default values for the configuration.
Users can choose between the UI driven Query builder and the Query code editor, that uses IoT SiteWise query language queries to fetch data. The Query builder offers a guided, less technical interface, whereas the Query code editor is more technical but also more powerful.
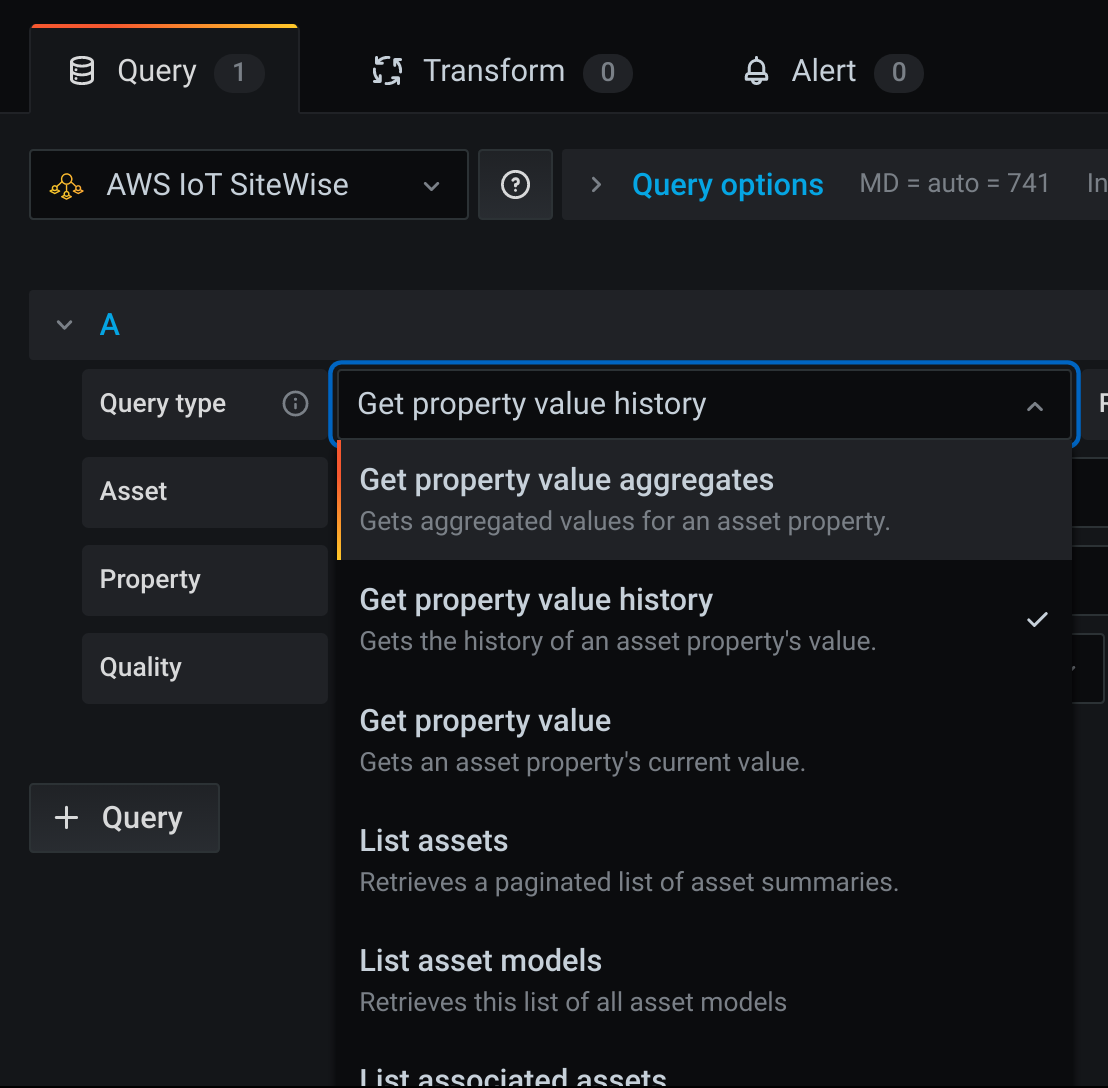
Use the "query type" selector to pick an appropriate query.
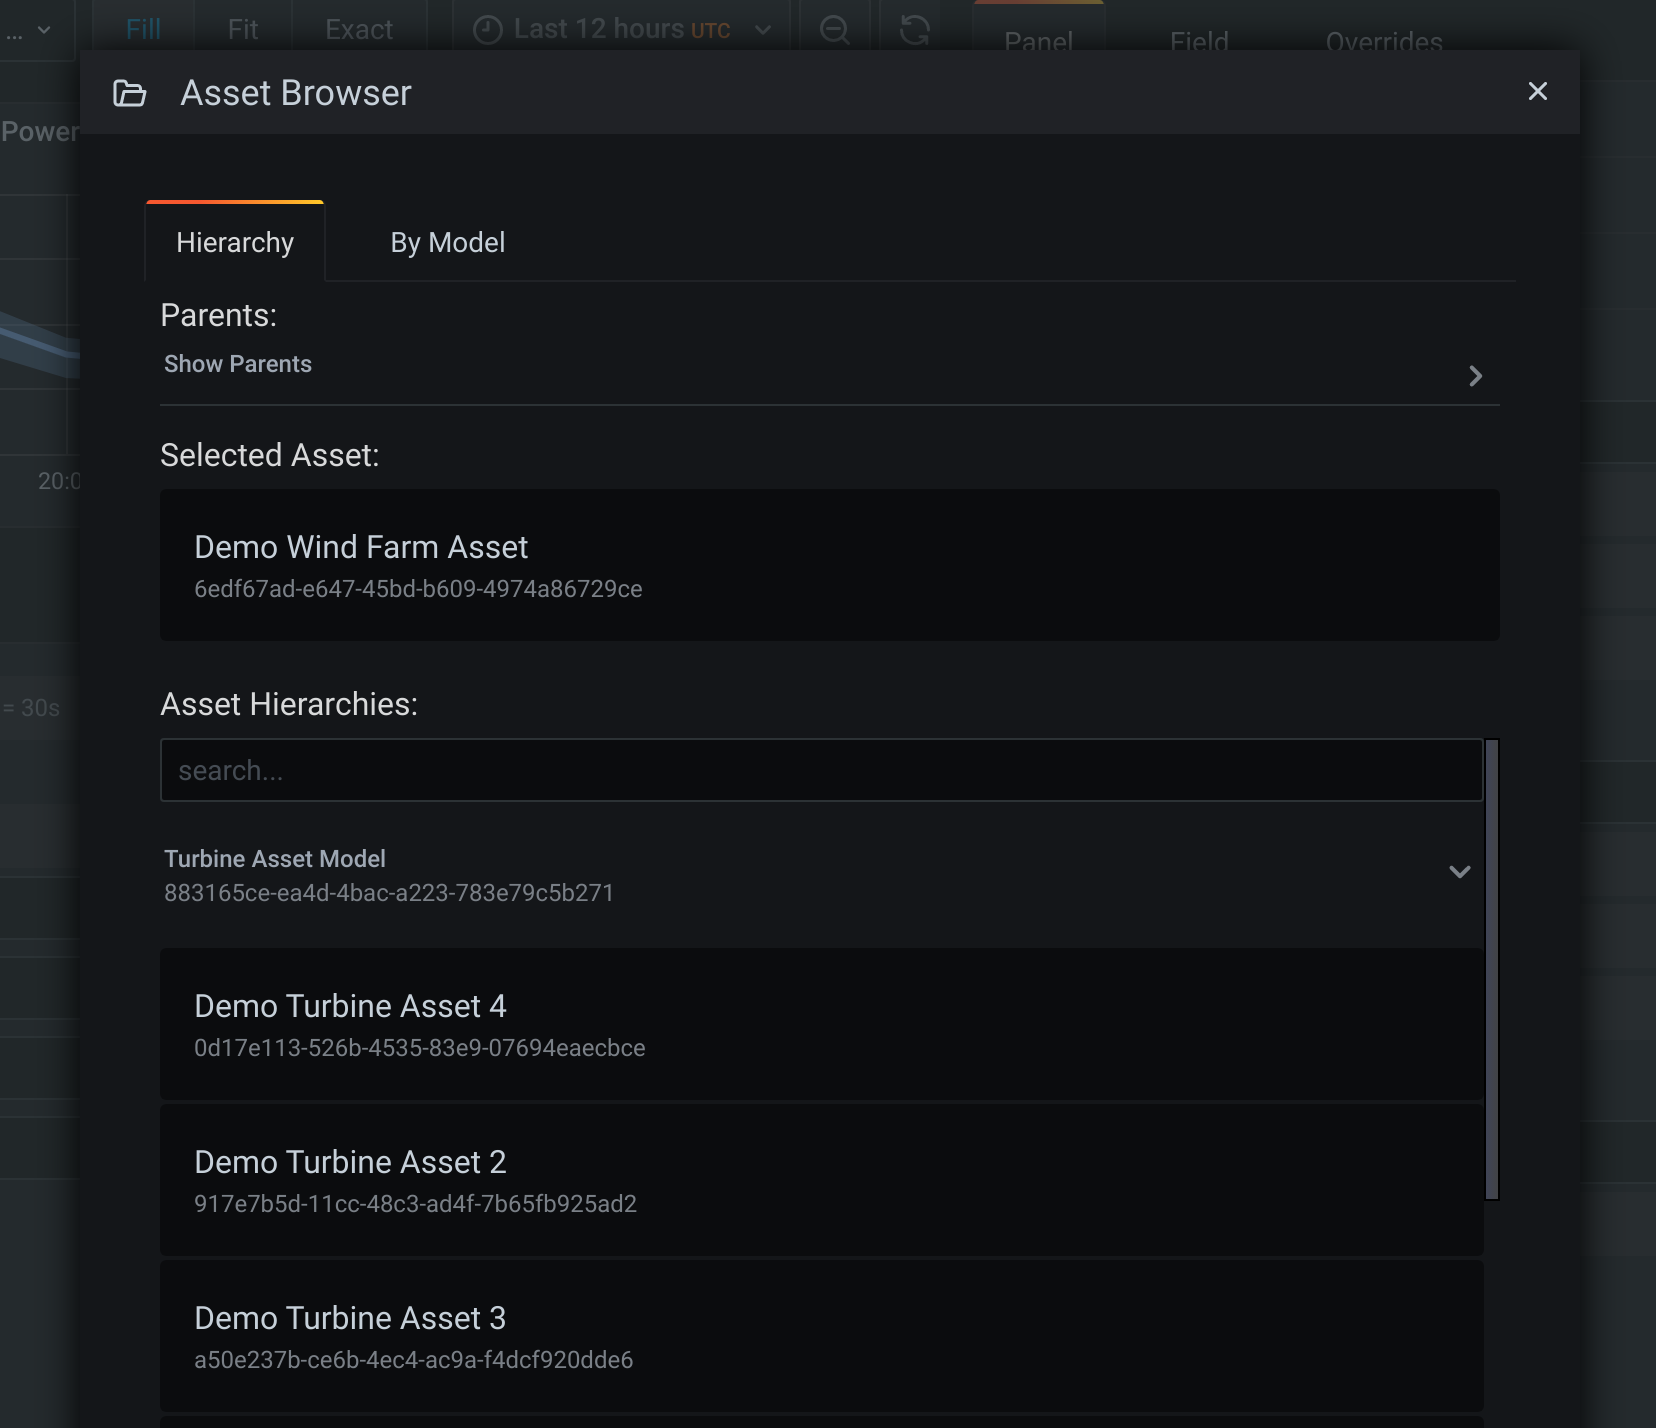
Click on the "Explore" button to open an asset/model navigation interface:
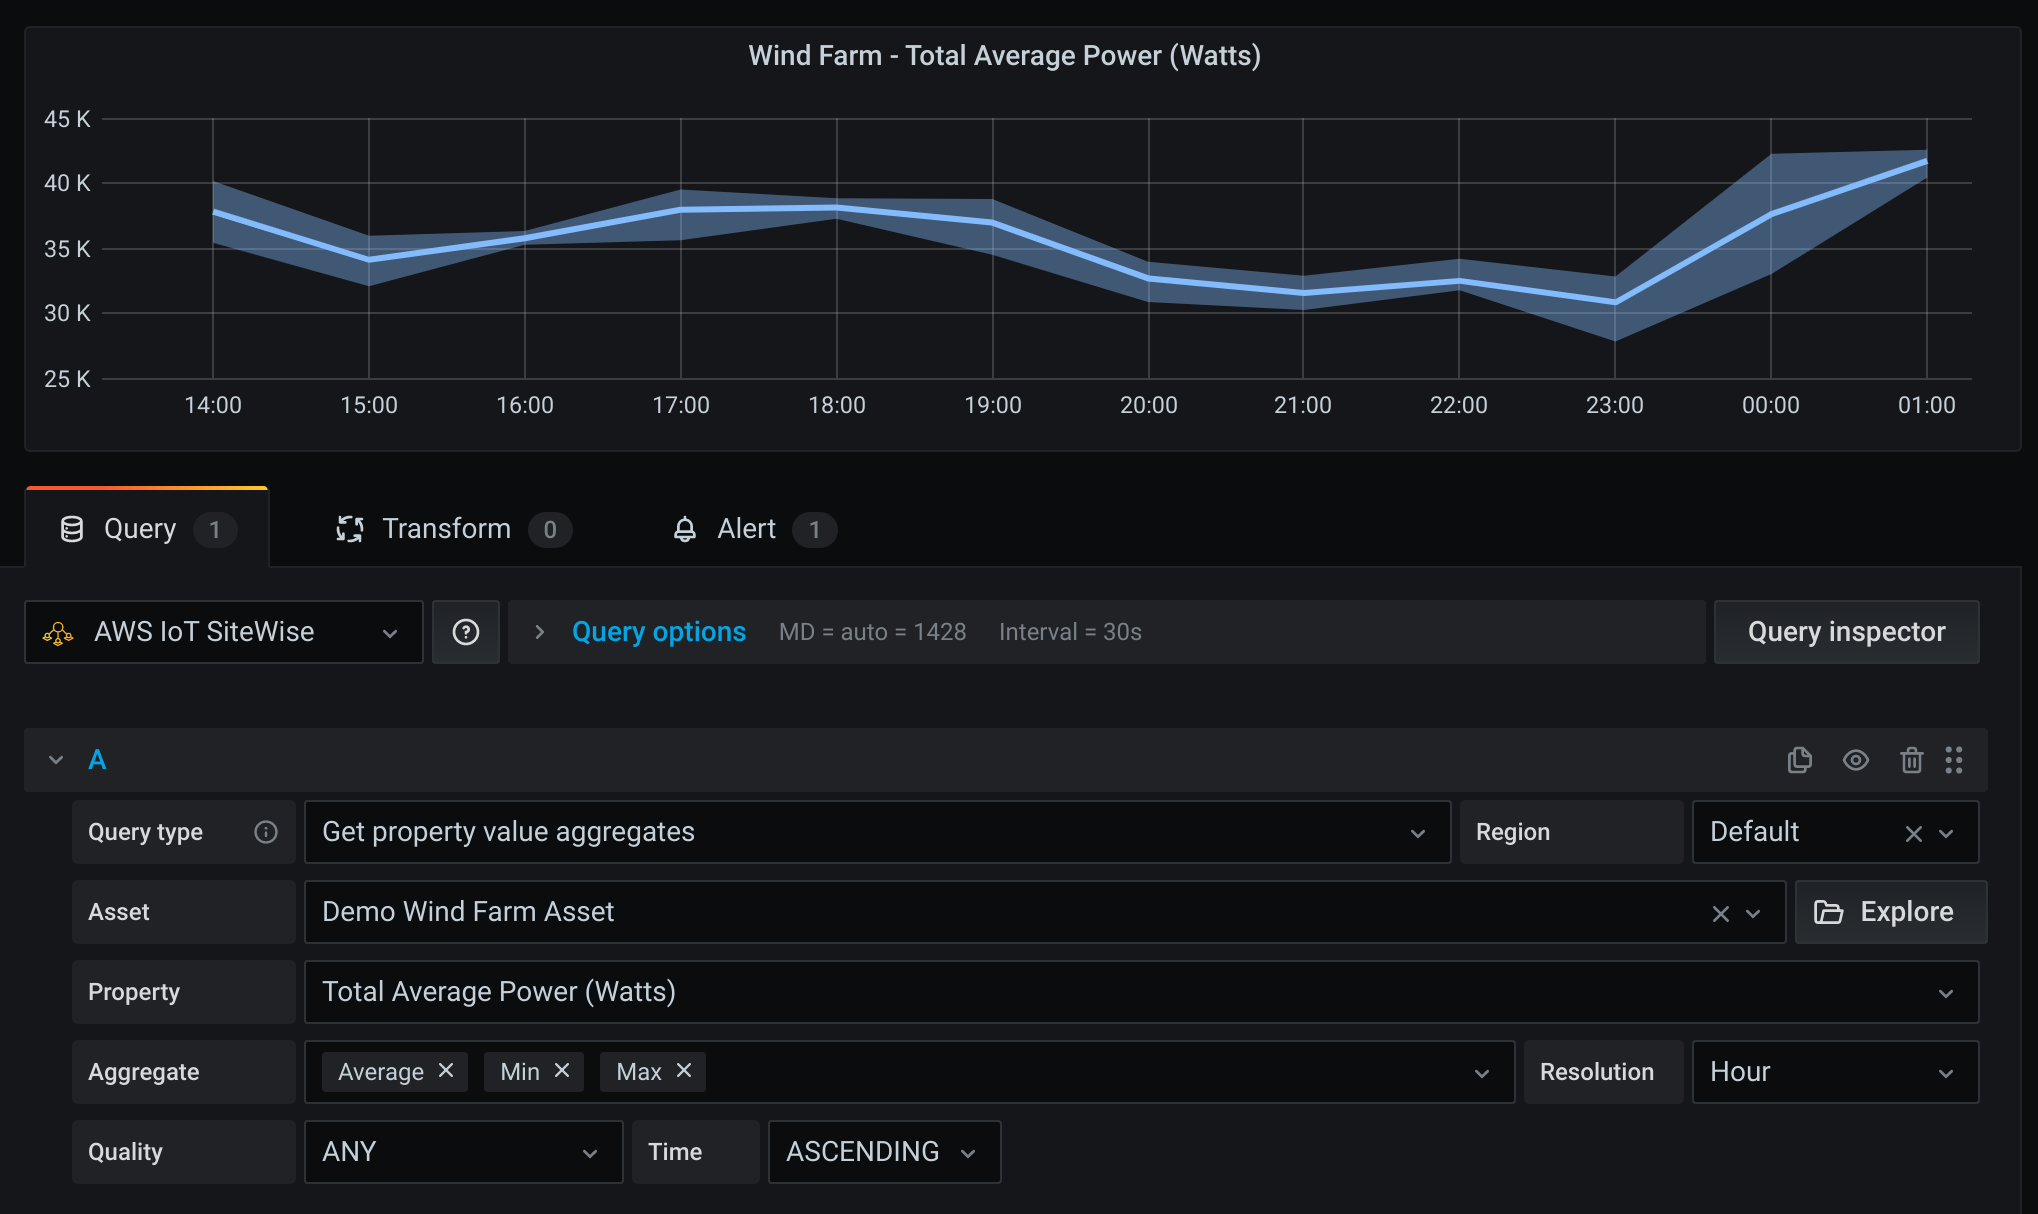
Multiple aggregations can be shown for a single property:
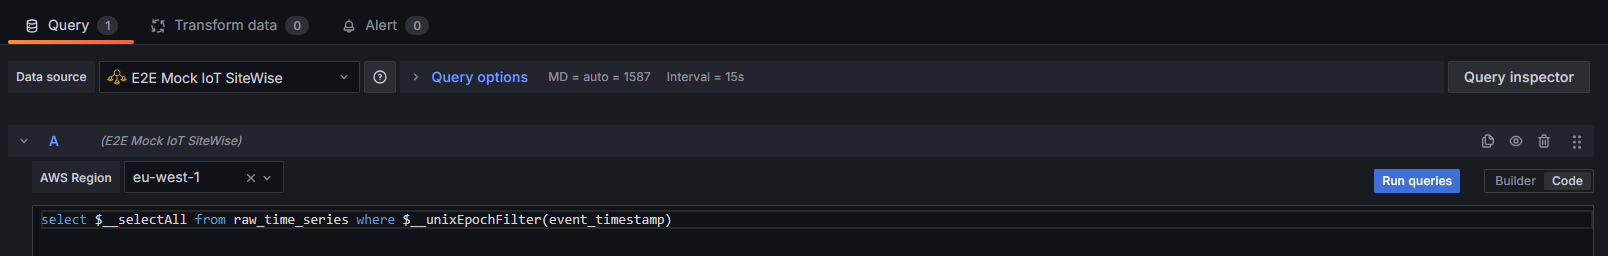
You can run IoT SiteWise query language queries in the code editor:
The query editor supports the following macros:
- $__selectAll - Shortcut to select available fields in the current table:
select $__selectAll from raw_time_series - $__rawTimeFrom - Lower limit of the time range as a timestamp:
select $__selectAll from latest_value_time_series where event_timestamp > $__rawTimeFrom - $__rawTimeTo - Upper limit of the time range as a timestamp:
select $__selectAll from raw_time_series where event_timestamp <= $__rawTimeTo - $__unixEpochFilter(column) - Filter the specified field according to the time range:
select $__selectAll from raw_time_series where $__unixEpochFilter(event_timestamp) - $__resolution - Shortcut to the applicable aggregate resolution based on the panel interval:
select $__selectAll from precomputed_aggregates where $__unixEpochFilter(event_timestamp) and resolution = '$__resolution'
The queries below provide a simple introduction to the IoT SiteWise query language. See the linked documentation for more details.
Retrieve all raw events
select $__selectAll from raw_time_series where $__unixEpochFilter(event_timestamp)Retrieve asset and property name along with raw events
select r.event_timestamp, a.asset_name, p.property_name, r.double_value
from asset a, asset_property p, raw_time_series r
where $__unixEpochFilter(event_timestamp)The following needs to be noted when querying and graphing time series data from raw_time_series:
- The values in the
event_timestampwill be Integer, and represents the timestamp in nanoseconds. - When filtering on the
event_timestampfield, it must be a timestamp specified in seconds.
So a typical setup will be to use the filters as shown in the example queries, and then applying the transforms as shown below.
For this example, we'll be using the following query:
select event_timestamp, double_value
from raw_time_series
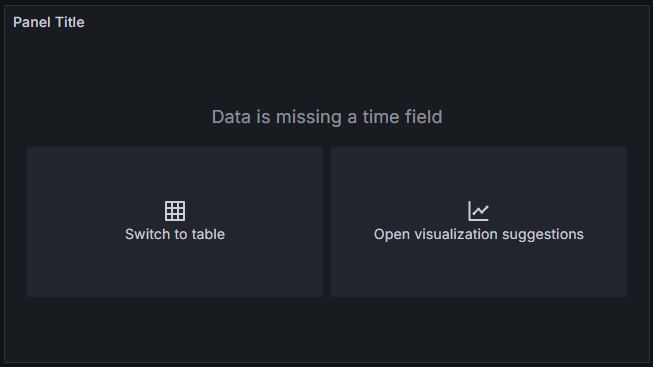
where $__unixEpochFilter(event_timestamp)This will result in a Grafana telling you that the Data is missing a time field:
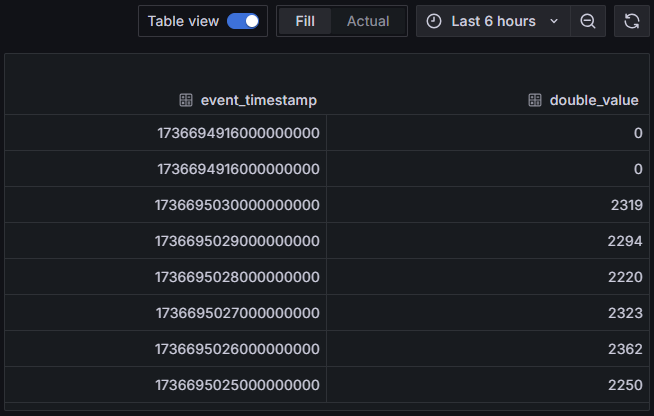
However, if you switch to the Table view, you'll see the data, including the event_timestamp values in nanoseconds:
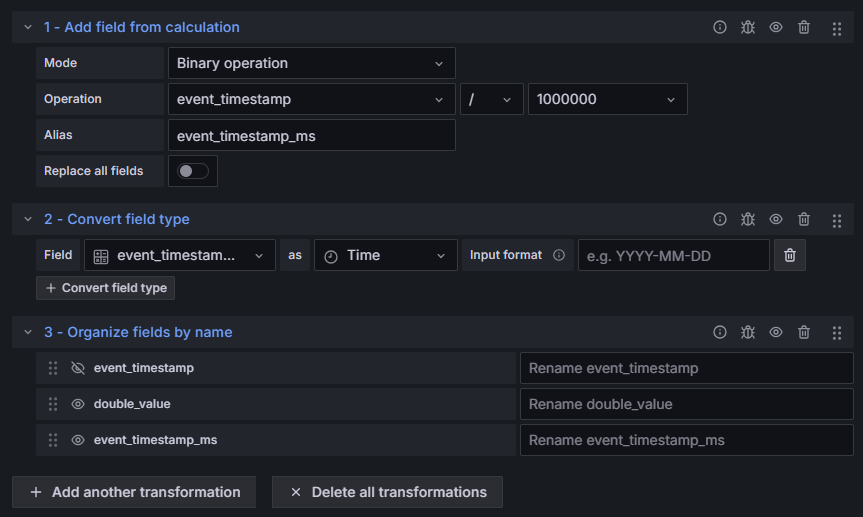
By converting the event_timestamp to seconds by using transforms, you can see a proper time series graph:
- Using
Add field from calculation, convert the event timestamp nanoseconds into milliseconds:- Mode:
Binary operation - Operation:
event_timestamp / 1000000 - Alias:
event_timestamp_ms
- Mode:
- Using
Convert field type, convert the event timestamp integer into a timestamp:- Field:
event_timestamp_ms - as:
Time
- Field:
- Using
Organize fields by name, hide theevent_timestampfield
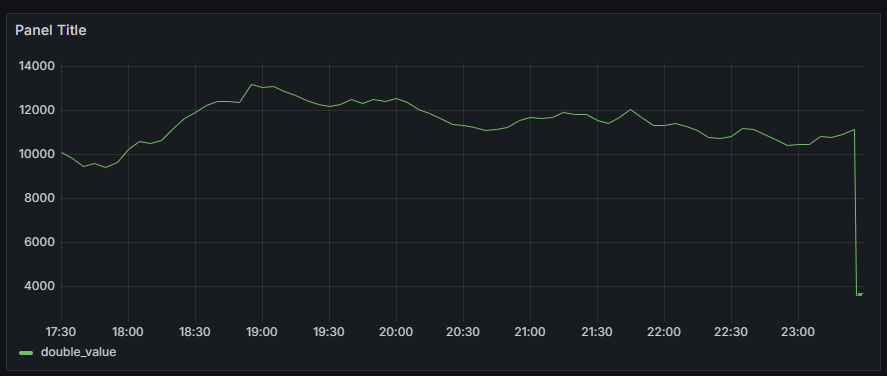
This will result in a time series graph as shown below.
Standard grafana alerting is support with this plugin, however note that alert queries may not include template variables. See the Alerting documentation for more on Grafana alerts.
You can configure data sources using config files with Grafana's provisioning system. You can read more about how it works and all the settings you can set for data sources on the provisioning docs page.
Here are some provisioning examples for this data source.
If you are using Credentials file authentication type, then you should use a credentials file with a config like this.
apiVersion: 1

datasources:
  - name: IoT SiteWise
    type: grafana-iot-sitewise-datasource
    jsonData:
      authType: credentials
defaultRegion: us-east-1apiVersion: 1
datasources:
- name: IoT SiteWise
type: grafana-iot-sitewise-datasource
jsonData:
authType: keys
defaultRegion: us-east-1
secureJsonData:
accessKey: '<your access key>'
secretKey: '<your secret key>'