Skip to content
This repository was archived by the owner on Aug 23, 2023. It is now read-only.

excessive / runaway heap usage attributed to github.com/gocql/gocql.copyBytes #1057

Closed
Dieterbe opened this issue Sep 19, 2018 · 4 comments
Closed
Labels

Comments

@Dieterbe
Copy link
Contributor

Dieterbe commented Sep 19, 2018

we have been seeing this for a little while now. possibly since somewhere july.
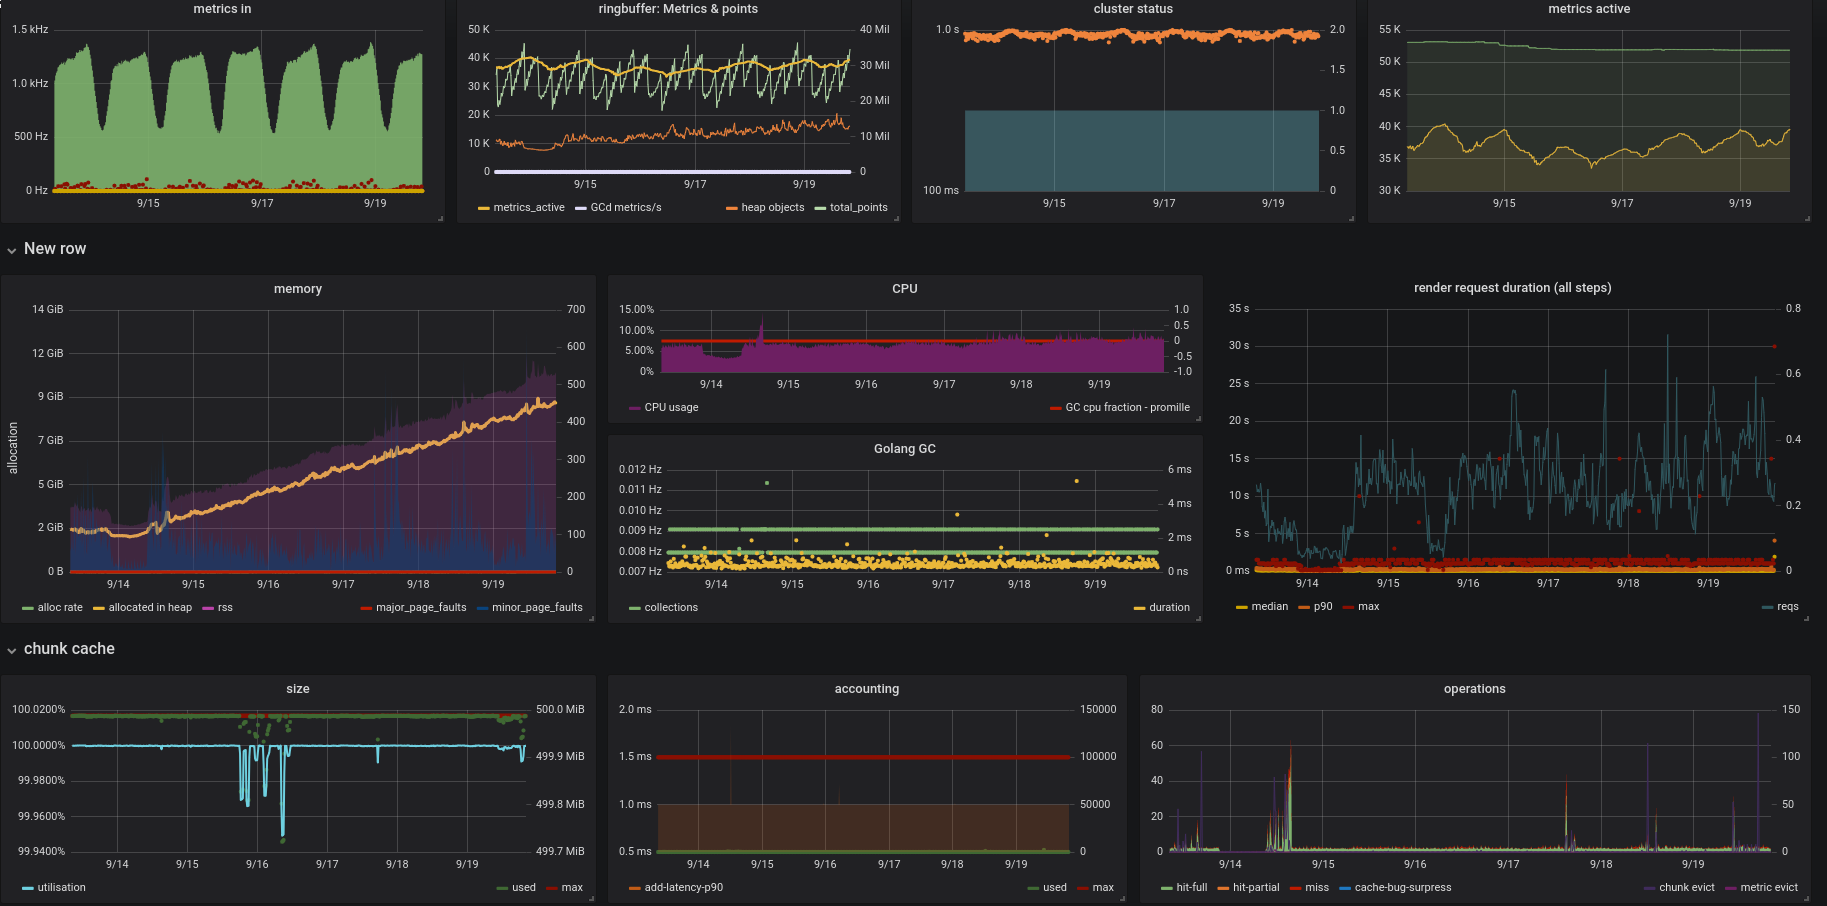
i just observed an instance doing it, running version 0.9.0-322-g5e667b3
can't share dashboard snapshot cause it contains confidential info, but i'm attaching a screenie of the relevant bits.
runaway-a

observations:

  • heap usage and rss usage gradually growing and growing
  • ingest rate, cpu usage, etc all constant
  • cache utilisation 100%, max and used 500MB
  • all other stats look normal (render latency etc)
File: metrictank
Type: inuse_space
Time: Sep 19, 2018 at 9:41pm (EEST)
Entering interactive mode (type "help" for commands, "o" for options)
(pprof) top15
Showing nodes accounting for 8723.27MB, 98.21% of 8882.44MB total
Dropped 104 nodes (cum <= 44.41MB)
Showing top 15 nodes out of 35
      flat  flat%   sum%        cum   cum%
 8142.16MB 91.67% 91.67%  8142.16MB 91.67%  github.com/grafana/metrictank/vendor/github.com/gocql/gocql.copyBytes (inline)
  343.53MB  3.87% 95.53%   344.03MB  3.87%  github.com/grafana/metrictank/mdata/cache.(*CCacheMetric).AddRange
   55.75MB  0.63% 96.16%    92.75MB  1.04%  github.com/grafana/metrictank/mdata/cache/accnt.(*LRU).touch
   48.08MB  0.54% 96.70%    48.08MB  0.54%  github.com/grafana/metrictank/vendor/github.com/dgryski/go-tsz.(*bstream).writeByte
   46.45MB  0.52% 97.23%    46.45MB  0.52%  github.com/grafana/metrictank/mdata/cache/accnt.(*FlatAccnt).addRange
   39.01MB  0.44% 97.66%    59.01MB  0.66%  github.com/grafana/metrictank/mdata.NewAggMetric
      35MB  0.39% 98.06%   174.20MB  1.96%  github.com/grafana/metrictank/mdata/cache/accnt.(*FlatAccnt).eventLoop
    7.50MB 0.084% 98.14%    45.51MB  0.51%  github.com/grafana/metrictank/mdata.NewAggregator
    2.03MB 0.023% 98.17%    61.04MB  0.69%  github.com/grafana/metrictank/mdata.(*AggMetrics).GetOrCreate
       2MB 0.023% 98.19%  8144.16MB 91.69%  github.com/grafana/metrictank/vendor/github.com/gocql/gocql.unmarshalVarchar
    1.76MB  0.02% 98.21%   349.30MB  3.93%  github.com/grafana/metrictank/mdata/cache.(*CCache).AddRange
         0     0% 98.21%  8491.46MB 95.60%  github.com/grafana/metrictank/api.(*Server).getSeries
         0     0% 98.21%  8491.46MB 95.60%  github.com/grafana/metrictank/api.(*Server).getSeriesCachedStore
         0     0% 98.21%  8491.46MB 95.60%  github.com/grafana/metrictank/api.(*Server).getSeriesFixed
         0     0% 98.21%  8491.46MB 95.60%  github.com/grafana/metrictank/api.(*Server).getTarget

#963 was also meant to troubleshoot this and may contain useful bits as well

full profile: mt-1057.zip

@Dieterbe
Copy link
Contributor Author

note how cache was already full for a while before mem started increasing. but that timegap didn't really have much cache activity, leading me to think it only kicks in once evictions happen, but memory also growth without any evictions happening.

@Dieterbe
Copy link
Contributor Author

next step I think would be to try to reproduce with docker stack. basically keep doing requests and see what happens when it hits the ceiling.

@Dieterbe
Copy link
Contributor Author

Dieterbe commented Sep 19, 2018

i see other instances in prod that also have full caches, do evictions, but have proper steady ram usage..
is-fine

@stale
Copy link

stale bot commented Apr 4, 2020

This issue has been automatically marked as stale because it has not had recent activity. It will be closed if no further activity occurs. Thank you for your contributions.

@stale stale bot added the stale label Apr 4, 2020
@stale stale bot closed this as completed Apr 11, 2020
Sign up for free to subscribe to this conversation on GitHub. Already have an account? Sign in.
Labels
Projects
None yet
Development

No branches or pull requests

1 participant