Improved Python application for real-time monitoring multiple SMA Sunny Boy inverters.
Now features a wider range of outputs, basically anything you see in your browser when connected to an SMA inverter with WebConnect can be pulled and sent to your InfluxDB database or as an MQTT message (or both).
- current AC production (site and inverter breakdowns)
- current DC production (site, inverter, and string breakdowns)
- total production (day, month, year, and lifetime)
- inverter efficiency
- inverter status
- co2 avoided due to PV production
- sun elevation and azimuth
- add any SMA sensors or setting for which you know the 'key'
- MQTT messaging
- InfluxDB interface (writes production data and status direct to InfluxDB)
- utility available to extract historical inverter production data to InfluxDB
multisma2 is driven by my desire to see what is happening in my ground mount solar array which uses three Sunny Boy inverters tied to eight strings of nine panels each (total 24.84 kWp). SMA offers Sunny Portal which is a non-real time window of the AC production and this quickly proved to be inadequate. It also uses an unknown and less than robust averaging algorithm which guarantees that I never see my peak production where there is the chance of the inverter limiting the output. There is more data available using the WebConnect interface but you need to log into each inverter to get it, with three inverters to check, multisma2 fixes this by working with one or many Sunny Boy inverters and combines the data intelligently for easy display or analysis.
I wanted a real-time dashboard in Home Assistant that displays both the site totals and the individual inverters so multisma2 is the result, building on the pysma project to log into each inverter and pull ALL the data in the Instantaneous values menu every 10 seconds from each inverter. This is cached and you display selected outputs at various intervals depending on your needs. For example, I report the AC production, DC production (by inverter and string), and inverter status every ten seconds. Slower changing outputs such as total production and sun elevation/azimuth occurs every 30 or 60 seconds.
multisma2 is pretty complete for my purposes but there could be small improvements and the inevitable bug fixes. Of course comments and feedback are welcome or you have a question on Sunny Boy inverters (at least the ones I have access to) feel free to ask.
A lot of this is new to me (a few months ago I had never seen Python) but hopefully it is pretty simple to setup multisma2 to connect to your SMA inverters and MQTT broker.
- Python 3.7 or later
- Python packages used
- paho-mqtt
- aiohttp
- asyncio
- astral
- python-dateutil
- jmespath
- influxdb
- pvlib (which requires pandas, numpy. scipy, and tables)
- SMA Sunny Boy inverter(s) supporting WebConnect
- Docker (a Dockerfile is supplied to allow running in a Docker container)
-
First up is to clone this repository:
git clone https://github.com/sillygoose/multisma2.git -
Copy
configuration.edittoconfiguration.py -
Edit
configuration.pyto match your site, you will need the IP addresses for each inverter and the login credentials. If you are using MQTT then you need the IP address of your MQTT broker and the optional login credentials, if interfacing to InfluxDB you need the host address and login credentials.There are some other fields to configure for the log files, time zone, site location, etc, these should be easy to figure out.
-
Test that multisma2 connects to your inverters, MQTT broker, or InfluxDB database:
python3 multisma2.py -
Docker setup
Once you have a working configuration.py file you can build a Docker container that runs multisma2:
    sudo docker build --no-cache -t multisma2:your-tag .
    sudo docker image tag multisma2:your-tag multisma2:latest
    sudo docker-compose up -d
where 'your-tag' is a name of your choosing. Since the docker-compose.yaml file assumes the image to be 'multisma2:latest', the second command adds this tag so I can use the docker-compose file to start the new instance and keep the old image as a backup until the new version checks out.
Sorry about the size and time to build the Docker image, adding the clear sky irradiance support in pvlib pulled in pandas, scipy, numpy, and other scientific packages that are built from source code. Building on a Raspberry Pi 4B running 64-bit Ubuntu takes about 15 minutes to complete and is not very slim in size. If I can figure out how to get the Alpine version to build perhaps it can slim down in the future.
It maybe helpful to understand these quirks about multisma2:
- multisma2 runs at full speed during daylight hours, which for now is defined from dawn to dusk. At night it slows down by a factor of 30 (10 second updates become 5 minute updates) to keep any applications like Home Assistant or OpenHAB updated.
| Interval | Outputs |
|---|---|
| 10s | AC production, DC production, inverter status |
| 30s | Total production (today, month, year, lifetime) |
| 60s | CO2 avoided |
| 300s | Production total (Wh) |
At night these updates based on the settings in pvsite.py:
    SAMPLE_PERIOD = [
        {'scale': 18},     # night (18 is 3 minute sample intervals)
        {'scale': 1},      # day (1 is 10 second sample intervals)
    ]
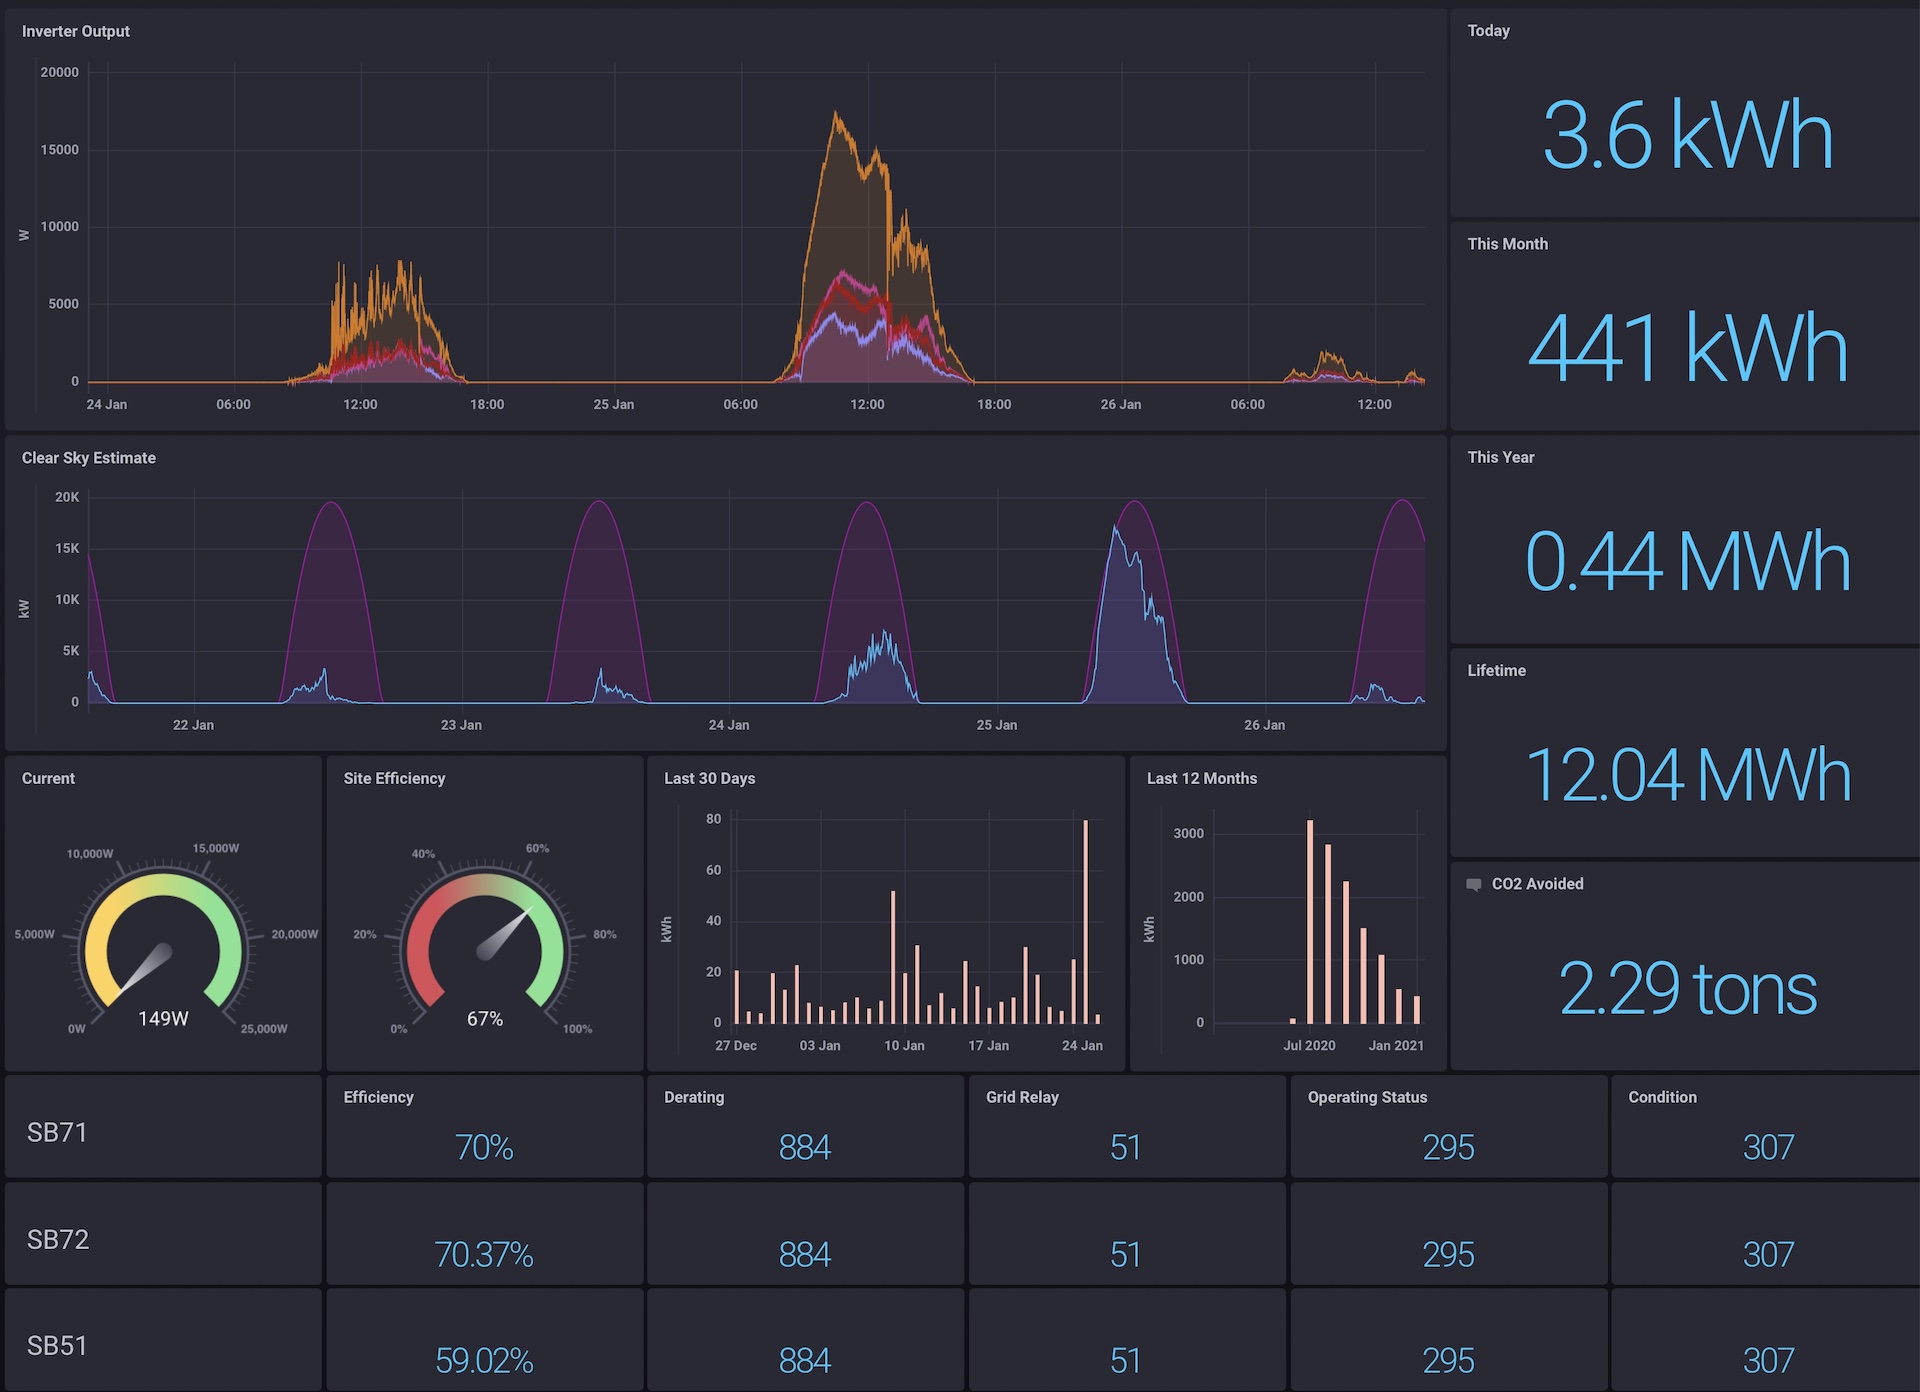
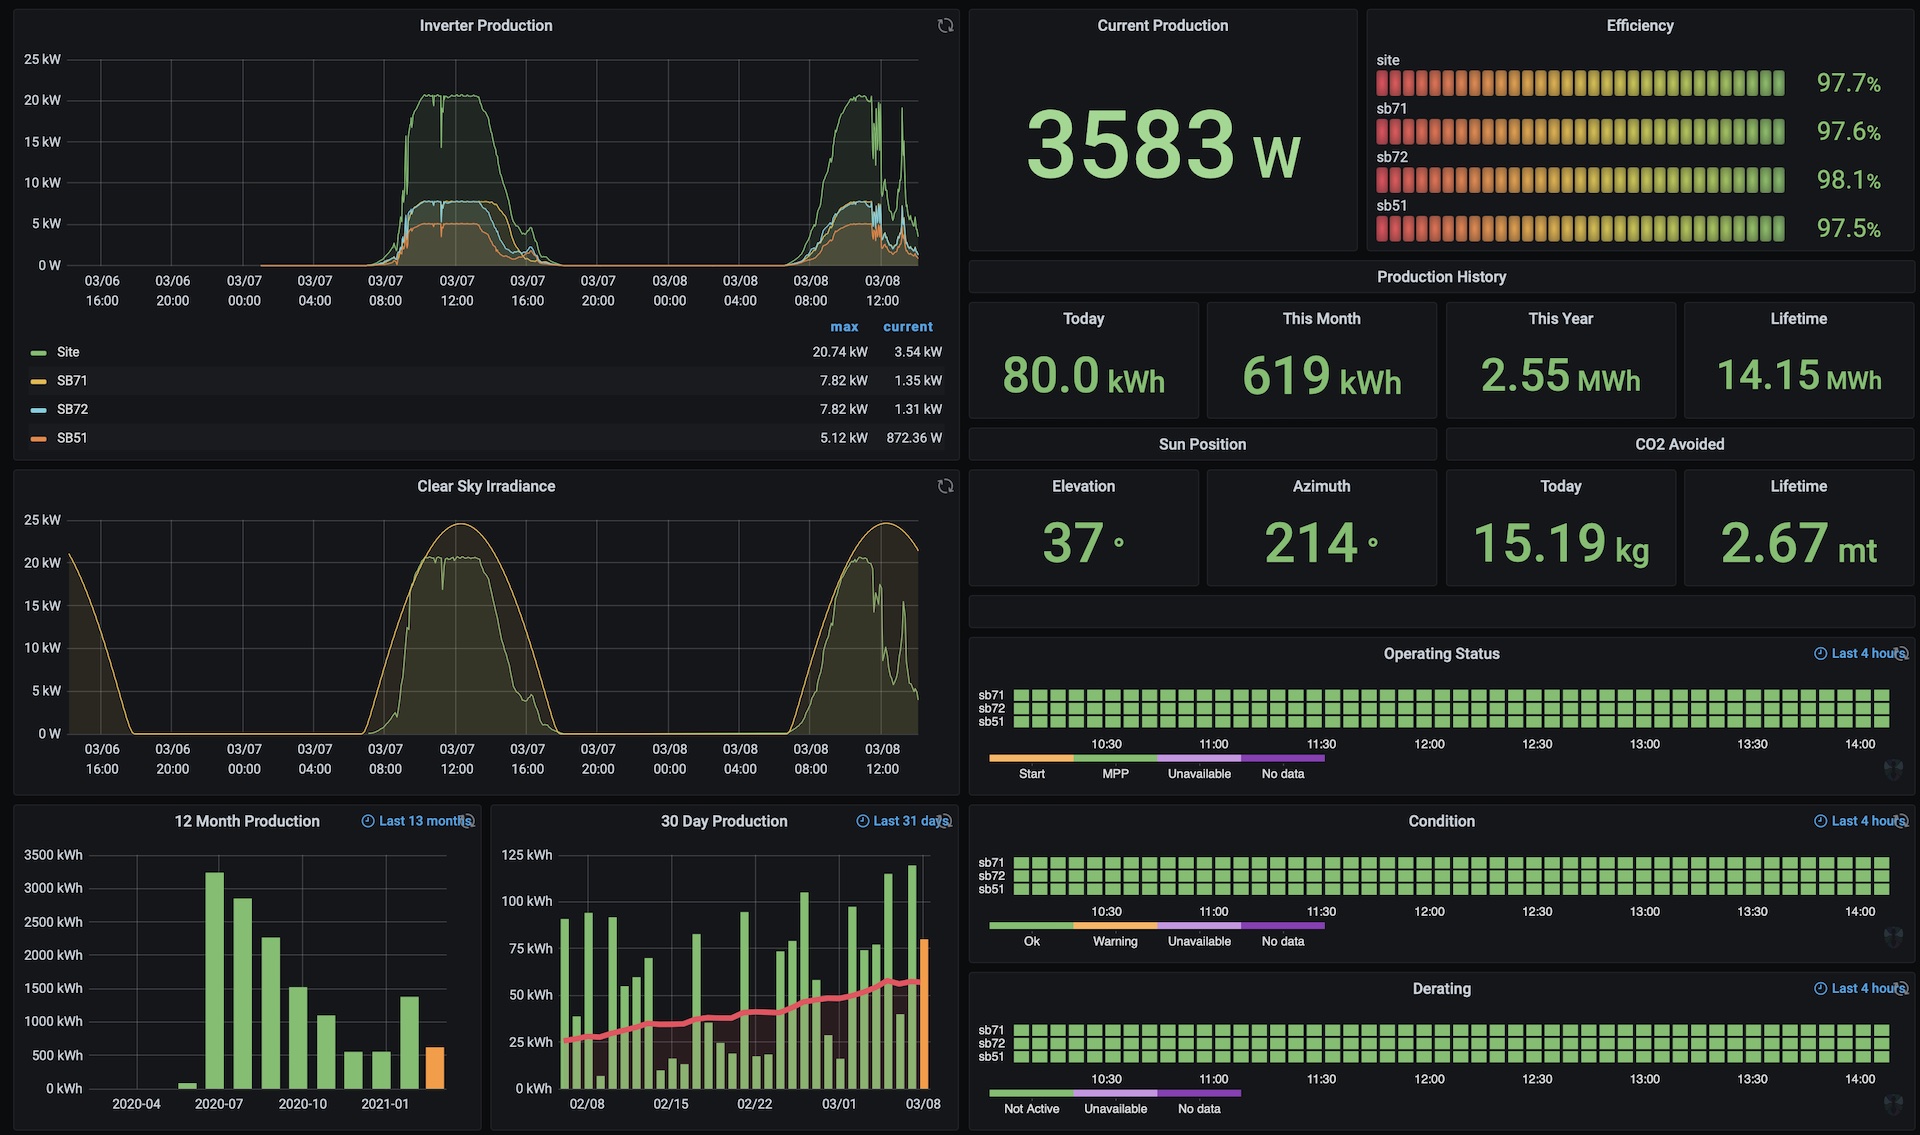
Still sorting these out but the following sample dashboards show some ideas on how the inverter data might be displayed. I especially like being able to pull the production data from InfluxDB to see the daily, monthly, and annual totals.
All InfluxDB queries are done in Flux, looked more powerful to me and since I didn't know SQL seemed like a better choice.
InfluxDB doesn't really handle state outputs like the inverter status very well so just integer state returned by the inverter is displayed, Grafana on the other hand has a Status Map visualization that looks more promising.
This dashboard uses the following panel plug-ins:
    grafana-cli plugins install flant-statusmap-panel
    grafana-cli plugins install mxswat-separator-panel
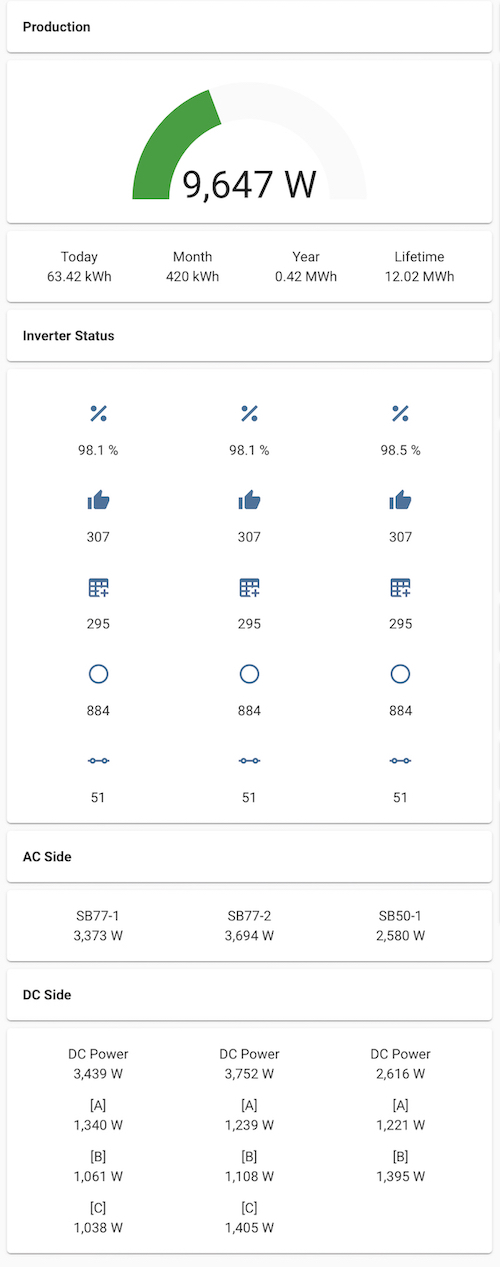
This last example is a dashboard made in Home Assistant driven by the MQTT output of multisma2, this was done first since MQTT support was completed before the InfluxDB support.


