Skip to content
New issue

Have a question about this project? Sign up for a free GitHub account to open an issue and contact its maintainers and the community.

By clicking “Sign up for GitHub”, you agree to our terms of service and privacy statement. We’ll occasionally send you account related emails.

Already on GitHub? Sign in to your account

I have set the clipToBorder to true, but it is still out of bounds #214

Closed
AndersIves opened this issue Mar 1, 2020 · 9 comments
Closed

Comments

@AndersIves
Copy link

AndersIves commented Mar 1, 2020

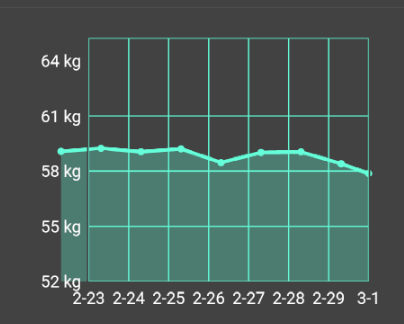
left side is out of bounds

how can i fix it like this

Hi,
Please provide us a reproducible code to solve the problem.
Thanks!

This is the class I defined


class SingleLineShadowChart extends StatefulWidget {
  final List<FlSpot> sports;
  final String yUnitString;

  final int days;

  SingleLineShadowChart(this.sports, this.yUnitString, this.days);

  @override
  _SingleLineShadowChartState createState() => _SingleLineShadowChartState();
}

class _SingleLineShadowChartState extends State<SingleLineShadowChart> {
  List<Color> gradientColors() {
    return [
      Theme.of(context).accentColor,
    ];
  }

  double minX = 0;
  double maxX = 0;
  double minY = 0;
  double maxY = 0;

  String getXTitleFunction(double value) {
    DateTime dateTime =
    DateTime.fromMillisecondsSinceEpoch(ConvertUtils.dse2mse(value));
    return "${dateTime.month}-${dateTime.day}";
  }

  String getYTitleFunction(double value) {
    return "${value.floor()} ${widget.yUnitString}";
  }

  @override
  void initState() {
    // TODO: implement initState
    super.initState();
  }

  @override
  Widget build(BuildContext context) {
    maxX = ConvertUtils.mse2dse(DateTime.now().millisecondsSinceEpoch);
    minX = ConvertUtils.mse2dse(DateTime.now().subtract(Duration(days: widget.days)).millisecondsSinceEpoch);
    maxY = widget.sports[0].y;
    minY = widget.sports[0].y;
    widget.sports.forEach((i) {
      if (i.y < minY) {
        minY = i.y;
      }
      if (i.y > maxY) {
        maxY = i.y;
      }
    });
    maxY = maxY + 0.1 * maxY;
    minY = minY - 0.1 * minY;
    return LineChart(
      LineChartData(
        clipToBorder: true,
        // 边框信息
        borderData: FlBorderData(
          show: true,
          border: Border.all(
            color: Theme.of(context).accentColor,
            width: 1,
          ),
        ),
        gridData: FlGridData(
          show: true,
          drawVerticalLine: true,

          verticalInterval: ((maxX - minX) / 4).floor().toDouble(),
          // 横向网格线
          getDrawingHorizontalLine: (value) {
            return FlLine(
              color: Theme.of(context).accentColor,
              strokeWidth: 1,
            );
          },
          horizontalInterval: ((maxY - minY) / 4).floor().toDouble(),
          // 纵向网格线
          getDrawingVerticalLine: (value) {
            return FlLine(
              color: Theme.of(context).accentColor,
              strokeWidth: 1,
            );
          },
        ),
        // 点击响应信息
        lineTouchData: LineTouchData(
          touchTooltipData: LineTouchTooltipData(
            tooltipBgColor:
            Theme.of(context).accentColor.withOpacity(0.2).withAlpha(100),
          ),
          handleBuiltInTouches: true,
        ),
        titlesData: FlTitlesData(
          show: true,
          // 下方文字
          bottomTitles: SideTitles(
            // 每隔几个显示一个
            interval: ((maxX - minX) / 4).floor().toDouble(),
            showTitles: true,
            // 文字与图表上边界距离
//          margin: 8,
            // 文字预留空间
//          reservedSize: 22,
            textStyle: Theme.of(context).textTheme.body1,
            getTitles: getXTitleFunction,
          ),
          leftTitles: SideTitles(
            // 每隔几个显示一个
            interval: ((maxY - minY) / 4).floor().toDouble(),
            showTitles: true,
            // 文字与图表左边界距离
//          margin: 8,
            // 文字预留空间
            reservedSize: 45,
            textStyle: Theme.of(context).textTheme.body1,
            getTitles: getYTitleFunction,
          ),
        ),
        // 个轴显示的最值 (不设置则缩放)
        minX: minX,
        maxX: maxX,
        minY: minY,
        maxY: maxY,
        // 数据
        lineBarsData: [
          LineChartBarData(
            spots: widget.sports,
            // 圆滑
            isCurved: (maxX - minX) > 50,
            // 线条颜色
            colors: gradientColors(),
            // 线条宽度
            barWidth: 3,
            // 起点和终点是否圆滑
            isStrokeCapRound: true,
            // 点配置
            dotData: FlDotData(
              show: (maxX - minX) < 15,
              dotColor: gradientColors()[0],
              dotSize: 3,
            ),
            // 线下方填充
            belowBarData: BarAreaData(
              show: true,
              colors: gradientColors()
                .map((color) => color.withOpacity(0.3))
                .toList(),
            ),
          ),
        ],
      ),
    );
  }
}

over bounds sample data


class DailyLifeView extends StatefulWidget {
  @override
  _DailyLifeViewState createState() {
    // TODO: implement createState
    return _DailyLifeViewState();
  }

}

class _DailyLifeViewState extends State<DailyLifeView> {

  @override
  Widget build(BuildContext context) {
    return Container(
      child: SingleLineShadowChart(
        [
          FlSpot(
            ConvertUtils.mse2dse(DateTime.now()
              .subtract(Duration(days: 0))
              .millisecondsSinceEpoch),
            60),
          FlSpot(
            ConvertUtils.mse2dse(DateTime.now()
              .subtract(Duration(days: 1))
              .millisecondsSinceEpoch),
            61),
          FlSpot(
            ConvertUtils.mse2dse(DateTime.now()
              .subtract(Duration(days: 2))
              .millisecondsSinceEpoch),
            62),
          FlSpot(
            ConvertUtils.mse2dse(DateTime.now()
              .subtract(Duration(days: 3))
              .millisecondsSinceEpoch),
            63),
          FlSpot(
            ConvertUtils.mse2dse(DateTime.now()
              .subtract(Duration(days: 4))
              .millisecondsSinceEpoch),
            64),
          FlSpot(
            ConvertUtils.mse2dse(DateTime.now()
              .subtract(Duration(days: 5))
              .millisecondsSinceEpoch),
            65),
          FlSpot(
            ConvertUtils.mse2dse(DateTime.now()
              .subtract(Duration(days: 6))
              .millisecondsSinceEpoch),
            66),
          FlSpot(
            ConvertUtils.mse2dse(DateTime.now()
              .subtract(Duration(days: 7))
              .millisecondsSinceEpoch),
            67),
          FlSpot(
            ConvertUtils.mse2dse(DateTime.now()
              .subtract(Duration(days: 8))
              .millisecondsSinceEpoch),
            68),
        ],
        "kg",
        7,
      ),
    );
  }
}

This is how i use it in my project


class BaseInfoWeightChart extends StatefulWidget {
  @override
  _BaseInfoWeightChartState createState() {
    // TODO: implement createState
    return _BaseInfoWeightChartState();
  }
}

class _BaseInfoWeightChartState extends State<BaseInfoWeightChart> {
  BaseInfoMapper baseInfoMapper = new BaseInfoMapper();
  List<int> size = [7, 30, 90, 30];
  int currentSize = 0;
  List<Widget> currentButton = [
    Text("<7>"),
    Text("<30>"),
    Text("<90>"),
    Text("<30>"),
  ];
  List<List<FlSpot>> baseInfoLists = [];

  bool hasData = false;

  Future<void> getDataAwait() async {
    DateTime now = DateTime.now();
    List<BaseInfo> baseInfoList = await baseInfoMapper.selectWhere(
        "updateTime > ${now.subtract(Duration(days: 91)).millisecondsSinceEpoch}",
        orderBy: "id DESC");
    hasData = baseInfoList.isNotEmpty;
    if (baseInfoList.isNotEmpty) {
      baseInfoLists.add([]);
      baseInfoLists.add([]);
      baseInfoLists.add([]);
      baseInfoLists.add([]);
      int day7ago = now.subtract(Duration(days: 8)).millisecondsSinceEpoch;
      int day30ago = now.subtract(Duration(days: 31)).millisecondsSinceEpoch;
      int day90ago = now.subtract(Duration(days: 91)).millisecondsSinceEpoch;
      baseInfoList.forEach((i) {
        FlSpot flSpot =
            FlSpot(ConvertUtils.mse2dse(i.getUpdateTime()), i.getWeight());
        if (i.getUpdateTime() > day7ago) {
          baseInfoLists[0].add(flSpot);
        }
        if (i.getUpdateTime() > day30ago) {
          baseInfoLists[1].add(flSpot);
          baseInfoLists[3].add(flSpot);
        }
        if (i.getUpdateTime() > day90ago) {
          baseInfoLists[2].add(flSpot);
        }
      });
    }
    setState(() {});
  }

  @override
  void initState() {
    // TODO: implement initState
    super.initState();

    getDataAwait();
  }

  @override
  Widget build(BuildContext context) {
    return MW.basicCard(
      context,
      title: Text(
        GL.text("体重"),
        style: Theme.of(context).textTheme.title,
      ),
      subTitle: Container(
        height: 20,
        child: FlatButton(
          child: currentButton[currentSize],
          onPressed: () {
            currentSize = (currentSize + 1) % size.length;
            setState(() {});
          },
        ),
      ),
      child: Stack(
        alignment: AlignmentDirectional.center,
        children: <Widget>[
          !hasData
              ? MW.emptyWidget
              : Container(
                  height: 270,
                  padding: EdgeInsets.only(top: 18, bottom: 18),
                  child: SingleLineShadowChart(
                    baseInfoLists[currentSize],
                    "kg",
                    size[currentSize],
                  ),
                ),
          hasData
              ? MW.emptyWidget
              : Text(
                  GL.text("无数据"),
                  style: TextStyle(
                    fontSize: 40,
                    color: Theme.of(context).accentColor,
                  ),
                ),
        ],
      ),
    );
  }
}

I’m truly grateful for your help.

@imaNNeo
Copy link
Owner

imaNNeo commented Mar 1, 2020

Hi,
Please provide us a reproducible code to solve the problem.
Thanks!

@AndersIves
Copy link
Author

AndersIves commented Mar 2, 2020

Hi,
Please provide us a reproducible code to solve the problem.
Thanks!

ConvertUtils

class ConvertUtils {
  static double mse2dse(int millisecondsSinceEpoch) {
    return millisecondsSinceEpoch / 86400000;
  }
  static int dse2mse(double daysSinceEpoch) {
    return (daysSinceEpoch * 86400000).floor();
  }
}

BaseInfoMapper was use to select data from database

@adrianvintu
Copy link

Same here.

I use this example, and set Y as: 5, then 0, then 5.

The rounded graphic goes under the bottom border.

See image here http://adrianvintu.net/temp/flutter_clipToBorder.jpg

@adrianvintu
Copy link

What exactly is clipToBorder ?

Using your sample, i set:

        getDrawingHorizontalLine: (value) {
          return FlLine(
            color: Colors.purple,
            strokeWidth: 5,
          );
        },

        border: Border(
          bottom: BorderSide(
            color: const Color(0xff4e4965),
            width: 10,
          ),
          left: BorderSide(
            color: Colors.transparent,
          ),
          right: BorderSide(
            color: Colors.transparent,
          ),
          top: BorderSide(
            color: Colors.pink,
            width: 10,
          ),

      minX: 0,
      maxX: 14,
      maxY: 6,
      minY: 0,
      //clipToBorder: true,
      lineBarsData: linesBarData1(),

and set some sports to zero FlSpot(7, 0),

Then i set clip to false http://adrianvintu.net/temp/flutter_no_clipToBorder.png

When setting clip to true, i get http://adrianvintu.net/temp/flutter_clipToBorder.png

What is those horizontal empty lines?
They also appear vertically, like in the previous comment http://adrianvintu.net/temp/flutter_clipToBorder.jpg

@adrianvintu
Copy link

For the comment where

The rounded graphic goes under the bottom border.

I found that setting the flag preventCurveOverShooting: true at LineChartBarData will fix the issue.

@imaNNeo
Copy link
Owner

imaNNeo commented Mar 6, 2020

clipBorder is the most useless thing in this repo, I don't know why I've developed it. btw your problem is not related to the clipBorder.
please provide ma a straight forward reproducible code (I just want to copy and paste it in my main.dart then run it).

@imaNNeo
Copy link
Owner

imaNNeo commented Mar 12, 2020

It's gonna be closed tomorrow if you don't provide me a full reproducible code (including the main function in a file)

@AndersIves
Copy link
Author

It's gonna be closed tomorrow if you don't provide me a full reproducible code (including the main function in a file)

These are my demos, you can copy and paste it in your main.dart to run it

import 'package:fl_chart/fl_chart.dart';
import 'package:flutter/material.dart';

void main() {
  runApp(MyApp());
}

class MyApp extends StatelessWidget {
  @override
  Widget build(BuildContext context) {
    return MaterialApp(
      theme: ThemeData(primarySwatch: Colors.pink),
      home: HomePage(),
    );
  }
}

class HomePage extends StatelessWidget {
  @override
  Widget build(BuildContext context) {
    // TODO: implement build
    return Scaffold(
      appBar: AppBar(
        title: Text(""),
      ),
      body: Center(
        child: Column(
          mainAxisAlignment: MainAxisAlignment.spaceAround,
          children: <Widget>[
            Text(
                "clipToBorder: true.\n\nbut left side and down side is out of bounds.\n\nand three quarters of the points in the upper right corner \nare out of bounds too."),
            LineChart(
              LineChartData(
                clipToBorder: true,
                borderData: FlBorderData(
                  show: true,
                  border: Border.all(
                    color: Theme.of(context).accentColor,
                    width: 1,
                  ),
                ),
                gridData: FlGridData(
                  show: true,
                  drawVerticalLine: true,
                  verticalInterval: 1,
                  getDrawingHorizontalLine: (value) {
                    return FlLine(
                      color: Theme.of(context).accentColor,
                      strokeWidth: 1,
                    );
                  },
                  horizontalInterval: 1,
                  getDrawingVerticalLine: (value) {
                    return FlLine(
                      color: Theme.of(context).accentColor,
                      strokeWidth: 1,
                    );
                  },
                ),
                lineTouchData: LineTouchData(
                  touchTooltipData: LineTouchTooltipData(
                    tooltipBgColor: Theme.of(context)
                        .accentColor
                        .withOpacity(0.2)
                        .withAlpha(100),
                  ),
                  handleBuiltInTouches: true,
                ),
                titlesData: FlTitlesData(
                  show: true,
                  bottomTitles: SideTitles(
                    interval: 1,
                    showTitles: true,
                    textStyle: Theme.of(context).textTheme.body1,
                    getTitles: (value) {
                      return value.toString();
                    },
                  ),
                  leftTitles: SideTitles(
                    interval: 1,
                    showTitles: true,
                    reservedSize: 45,
                    textStyle: Theme.of(context).textTheme.body1,
                    getTitles: (value) {
                      return value.toString();
                    },
                  ),
                ),
                minX: 2,
                maxX: 10,
                lineBarsData: [
                  LineChartBarData(
                    spots: [
                      FlSpot(1, 5),
                      FlSpot(2, 2),
                      FlSpot(3, 3),
                      FlSpot(4, 4),
                      FlSpot(5, 2),
                      FlSpot(6, 6),
                      FlSpot(7, 7),
                      FlSpot(8, 1),
                      FlSpot(9, 1),
                      FlSpot(10, 10),
                    ],
                    isCurved: true,
                    colors: [Theme.of(context).accentColor],
                    barWidth: 3,
                    isStrokeCapRound: true,
                    dotData: FlDotData(
                      show: true,
                      dotColor: Theme.of(context).accentColor,
                      dotSize: 3,
                    ),
                    belowBarData: BarAreaData(
                      show: true,
                      colors: [Theme.of(context).accentColor]
                          .map((color) => color.withOpacity(0.3))
                          .toList(),
                    ),
                  ),
                ],
              ),
            ),
          ],
        ),
      ),
    );
  }
}

thx

@imaNNeo
Copy link
Owner

imaNNeo commented Mar 14, 2020

Fixed in 0.8.4,
Thanks for reporting.

@imaNNeo imaNNeo closed this as completed Mar 14, 2020
Sign up for free to join this conversation on GitHub. Already have an account? Sign in to comment
Labels
None yet
Projects
None yet
Development

No branches or pull requests

3 participants