Skip to content
This repository has been archived by the owner on Aug 2, 2023. It is now read-only.

Debugger not stopping at breakpoints with virtual environment #2096

Closed
MarkBaggett opened this issue Feb 22, 2020 · 18 comments
Closed

Debugger not stopping at breakpoints with virtual environment #2096

MarkBaggett opened this issue Feb 22, 2020 · 18 comments

Comments

@MarkBaggett
Copy link

MarkBaggett commented Feb 22, 2020

Issue Type: Bug

SYSTEM SETUP:
Host Windows 10 Home Edition
Environment Information: Python 3.8.1
Version: 1.42.1 (system setup)
Commit: c47d83b
Date: 2020-02-11T14:45:59.656Z
Electron: 6.1.6
Chrome: 76.0.3809.146
Node.js: 12.4.0
V8: 7.6.303.31-electron.0
OS: Windows_NT x64 10.0.18363

TO REPRODUCE:
Step 1: Create a Virtual environement and activate ( I have tried both venv and virtualenv. They both produce the same error).

C:\Users\mark_\Documents>python -m virtualenv MyVirtualEnv
C:\Users\mark_\Documents>cd MyVirtualEnv
C:\Users\mark_\Documents\MyVirtualEnv>powershell
PS C:\Users\mark_\Documents\MyVirtualEnv> .\Scripts\activate.ps1
(MyVirtualEnv) PS C:\Users\mark_\Documents\MyVirtualEnv> code .

Step 2: Try to debug a program.
Create a python program (I created as simple loop with a print statement) and put break points on every line.
When the interpreter is set to the MyVirtualenv:venv it will not stop at breakpoints. When it is set to the main system interpreter it does. (But no modules are available.)

Nothing special about launch.json. (I did try turning on stop on entry and that didn't work either)

{
// Use IntelliSense to learn about possible attributes.
// Hover to view descriptions of existing attributes.
// For more information, visit: https://go.microsoft.com/fwlink/?linkid=830387
"version": "0.2.0",
"configurations": [
{
"name": "Python: Current File",
"type": "python",
"request": "launch",
"program": "${file}",
"console": "integratedTerminal"
}
]
}

Integrated Terminal Output:

PS C:\Users\mark_\Documents\MyVirtualEnv> cd 'c:\Users\mark_\Documents\MyVirtualEnv'; ${ on-2020.2.63072\pythonFiles\ptvsd_launcher.py' '--default' '--client' '-env:PYTHONIOENCODING}='UTF-8'; ${env:PYTHONUNBUFFERED}='1'; & 'C:\Users\mark_\Documents\env:PYTHONIOENCODING}='UTF-8'; ${env:PYTHONUMyVirtualEnv\Scripts\python.exe' 'c:\Users\mark_.vscode\extensions\ms-python.python-202ark_.vscode\extensions\ms-python.python-202NBUFFERED}='1'; & 'C:\Users\mark_\Documents\MyVirtualEnv\Scripts\python.0.2.63072\pythonFiles\ptvsd_launcher.py' '--default' '--client' '--host' 'localhost' '--port' '54576' 'c:\Users\mark_\Documents\MyVi 'localhost' '--port' '54576' 'c:\Users\mark_\Documents\MyVirtualEnv\tesport' '54576' 'c:\Users\mark_\Documents\MyVirtualEnv\test.py'
1
2
..

There is this (perhaps unrelated) error in be CONSOLE tab of the developer tools that looks suspicious to me.

/C:/Program Files/Mi…desktop.main.js:259 [Extension Host] Error Python Extension: 2020-02-16 06:28:26: Failed to get interpreter information for 'C:\Users\mark_\AppData\Local\Microsoft\WindowsApps\python3.exe' [Error: Command failed: "C:\Users\mark_\AppData\Local\Microsoft\WindowsApps\python3.exe" "c:\Users\mark_.vscode\extensions\ms-python.python-2020.2.63072\pythonFiles\interpreterInfo.py"
Python was not found but can be installed from the Microsoft Store: https://go.microsoft.com/fwlink?linkID=2082640
at ChildProcess.exithandler (child_process.js:303:12)
at ChildProcess.emit (events.js:200:13)
at maybeClose (internal/child_process.js:1021:16)
at Process.ChildProcess.handle.onexit (internal/child_process.js:283:5)] {
killed: false,
code: 9009,
signal: null,
cmd: '"C:\\Users\mark\AppData\Local\Microsoft\WindowsApps\python3.exe" ' +
'"c:\Users\mark_\.vscode\extensions\ms-python.python-2020.2.63072\pythonFiles\interpreterInfo.py"'
}
/C:/Program Files/Mi…desktop.main.js:259 [Extension Host] Error Python Extension: 2020-02-16 06:28:26: Failed to get interpreter information for 'C:\Users\mark_\AppData\Local\Microsoft\WindowsApps\python.exe' [Error: Command failed: "C:\Users\mark_\AppData\Local\Microsoft\WindowsApps\python.exe" "c:\Users\mark_.vscode\extensions\ms-python.python-2020.2.63072\pythonFiles\interpreterInfo.py"
Python was not found but can be installed from the Microsoft Store: https://go.microsoft.com/fwlink?linkID=2082640
at ChildProcess.exithandler (child_process.js:303:12)
at ChildProcess.emit (events.js:200:13)
at maybeClose (internal/child_process.js:1021:16)
at Process.ChildProcess.handle.onexit (internal/child_process.js:283:5)] {
killed: false,
code: 9009,
signal: null,
cmd: '"C:\\Users\mark\AppData\Local\Microsoft\WindowsApps\python.exe" ' +
'"c:\Users\mark_\.vscode\extensions\ms-python.python-2020.2.63072\pythonFiles\interpreterInfo.py"'
}
/
VS Code version: Code 1.42.1 (c47d83b, 2020-02-11T14:45:59.656Z)
OS version: Windows_NT x64 10.0.18363

Expected behaviour

Stop at breakpoints

Actual behaviour

Not stopping at breakpoints
breakpoint-no-stop2

@karthiknadig karthiknadig transferred this issue from microsoft/vscode-python Feb 24, 2020
@int19h
Copy link
Contributor

int19h commented Feb 25, 2020

Can you try enabling the experimental debugger, and see if that makes any difference for you?

@MarkBaggett
Copy link
Author

I installed the extension, added the configuration and it still does not stop. As I have not used this extension before can you confirm for me I am doing this correctly? Here is a gif.

code_debugger_with_extension

@karthiknadig
Copy link
Member

@MarkBaggett These settings should be added to user settings not launch.json. you can get to it using ctrl+, on windows.

"python.experiments.optInto": [
        "DebugAdapterFactory - experiment",
        "PtvsdWheels37 - experiment"
    ]

@MarkBaggett
Copy link
Author

Done. Didn't seem to make a difference.

debug_experiment

@karthiknadig
Copy link
Member

@MarkBaggett Thank you for sharing the gifs. These are really helpful. When you look at the debugger path, it still shows ptvsd_launcher.py. It is still using the old debugger. Can you show these lines from your Output > Python panel?
image

@MarkBaggett
Copy link
Author

Im lost. I reverted to an earlier shapshot and reinstalled the experimental debugger. Then tried again so you could see the entire process. Hopefully something here stands out to you.

breakpoint-no-stop

@MarkBaggett
Copy link
Author

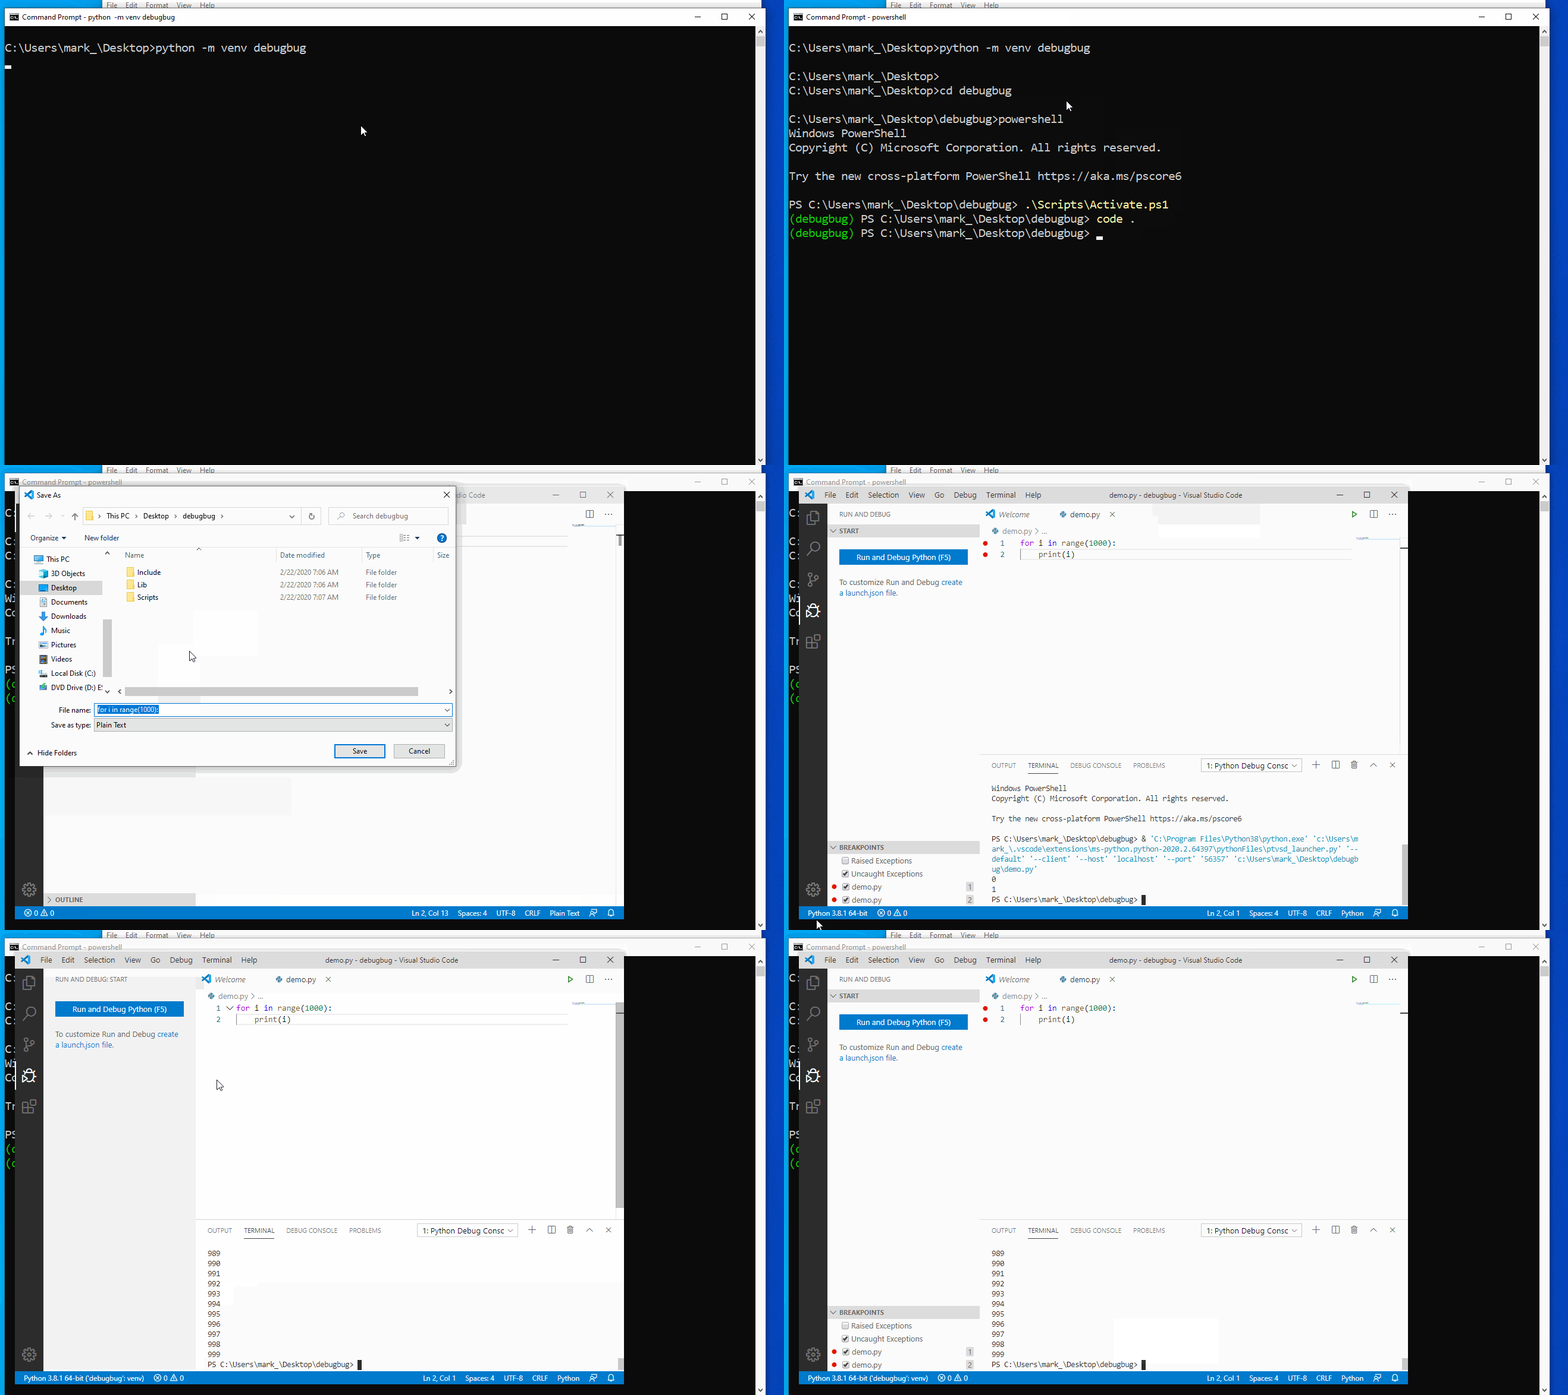
Interesting I inspected my settings.json directly rather than going through the visual code interface and it didn't have the changes. I edited the settings.json directly. Here is the result.

breakpoint-no-stop2

@MarkBaggett
Copy link
Author

Does this help? Does the roaming profile have something to do with this problem?

@int19h
Copy link
Contributor

int19h commented Mar 24, 2020

My apologies, the notification slipped through.

@karthiknadig, is there anything else that could possibly be the reason why it keeps using the old debugger? Telemetry?

@karthiknadig
Copy link
Member

Make sure you have the latest version of the extension, it should be >= 2020.3.*. Then check telemetry settings, make sure both are set.
image

Make sure this setting is also set:
image

Please reload after changing. After reloading check Python output panel, it should have those lines at the top which start with "User belongs to ...". See screen shot in this comment: image

If the extension activates (open a python file) and all settings have be correctly set, you should see the line that says, along with other things. This is the one that gets you the new debugger.

User belongs to experiment group 'PtvsdWheels37 - experiment'

@MarkBaggett
Copy link
Author

I have confirmed the version of the extension. I have confirmed the settings. I have confirmed the output are all as you say they should be. No change. Please see the image below

breakpoint-no-stop3

@fabioz
Copy link
Contributor

fabioz commented Apr 1, 2020

@MarkBaggett can you provide the logs for the run where the breakpoint is not being hit?

i.e.:

  • Open VS Code
  • Select the command Extensions: Open Extensions Folder
  • Locate the Python extension directory, typically of the form ms-python.python-2020..***
  • In that directory ensure you do not have any debug*.log files, if you do, please delete them
  • Go back into VS Code and modify your launch.json to add the setting "logToFile": true, see below:
"version": "0.2.0",
"configurations": [
    {
        "name": "Python: Current File (Integrated Terminal)",
        "type": "python",
        "request": "launch",
        "program": "${file}",
        "stopOnEntry": true,
        "console": "integratedTerminal",
        "logToFile": true
    },
  • Start debugging
  • When done, go back into the extension directory and upload the debug*.log files into this GitHub issue.

@MarkBaggett
Copy link
Author

Done.

breakpoint-no-stop4

debugpy.launcher-10508.zip

@fabioz
Copy link
Contributor

fabioz commented Apr 1, 2020

What is happening is that with the setting justMyCode:true all the files that are considered to be part of the standard library are skipped and workspace folder is the same folder used for the venv, it's skipped too.

i.e.: this can be seen by the response to the set breakpoints:

{
 "pydevd_cmd_id": 502,
 "seq": 18,
 "type": "response",
 "request_seq": 8,
 "success": true,
 "command": "setBreakpoints",
 "body": {
     "breakpoints": [
         {
             "verified": false,
             "message": "Breakpoint in file excluded by filters.\nNote: may be excluded because of \"justMyCode\" option (default == true).Try setting \"justMyCode\": false in the debug configuration (e.g., launch.json).\n",
             "source": {
                 "name": "demo.py",
                 "path": "c:\\Users\\mark_\\Desktop\\debugerr\\demo.py"
             },
             "line": 1
         },
         {
             "verified": false,
             "message": "Breakpoint in file excluded by filters.\nNote: may be excluded because of \"justMyCode\" option (default == true).Try setting \"justMyCode\": false in the debug configuration (e.g., launch.json).\n",
             "source": {
                 "name": "demo.py",
                 "path": "c:\\Users\\mark_\\Desktop\\debugerr\\demo.py"
             },
             "line": 2
         }
     ]
 }
}

And the settings also show:

sys.prefix: C:\Users\mark_\Desktop\debugerr
"workspaceFolder": "c:\\Users\\mark_\\Desktop\\debugerr",

@karthiknadig @int19h should this actually work? i.e.: I don't remember doing any special treatment for the case where sys.prefix==workspaceFolder (should this be actually accepted or should we show some warning?)

-- I think that the usual case is having workspaceFolder/venv, so, the solution right now would be changing that structure locally so that the workspace contains the venv or set justMyCode:false in the launch.

@int19h
Copy link
Contributor

int19h commented Apr 1, 2020

The upside is that you are definitely using the new debugger now!

It looks like breakpoints get excluded by path filters for some reason:

D+00002.172: /handling #4 request "setBreakpoints" from Client[1]/
             Server[1] <-- {
                 "seq": 8,
                 "type": "request",
                 "command": "setBreakpoints",
                 "arguments": {
                     "source": {
                         "name": "demo.py",
                         "path": "c:\\Users\\mark_\\Desktop\\debugerr\\demo.py"
                     },
                     "lines": [
                         1,
                         2
                     ],
                     "breakpoints": [
                         {
                             "line": 1
                         },
                         {
                             "line": 2
                         }
                     ],
                     "sourceModified": false
                 }
             }

D+00002.172: Server[1] --> {
                 "pydevd_cmd_id": 502,
                 "seq": 18,
                 "type": "response",
                 "request_seq": 8,
                 "success": true,
                 "command": "setBreakpoints",
                 "body": {
                     "breakpoints": [
                         {
                             "verified": false,
                             "message": "Breakpoint in file excluded by filters.\nNote: may be excluded because of \"justMyCode\" option (default == true).Try setting \"justMyCode\": false in the debug configuration (e.g., launch.json).\n",
                             "source": {
                                 "name": "demo.py",
                                 "path": "c:\\Users\\mark_\\Desktop\\debugerr\\demo.py"
                             },
                             "line": 1
                         },
                         {
                             "verified": false,
                             "message": "Breakpoint in file excluded by filters.\nNote: may be excluded because of \"justMyCode\" option (default == true).Try setting \"justMyCode\": false in the debug configuration (e.g., launch.json).\n",
                             "source": {
                                 "name": "demo.py",
                                 "path": "c:\\Users\\mark_\\Desktop\\debugerr\\demo.py"
                             },
                             "line": 2
                         }
                     ]
                 }
             }

One thing that looks off to me is the path to interpreter:

"pythonPath": "C:\\Users\\mark_\\Desktop\\debugerr\\Scripts\\python.exe"

This implies that C:\Users\mark_\Desktop\debugerr is a virtual environment. If so, this is sort of working as intended, because virtual environments aren't expected to contain user code normally, and debugger treats everything under it as library code; and you have demo.py directly underneath.

You can override that with "justMyCode": false, but it might be better to avoid putting your scripts there in the first place. The usual code structure is to have the environment in its own separate folder under your workspace, i.e.:

  • debugerr
    • env
      • Scripts
        • python.exe
      • ...
    • demo.py

@MarkBaggett
Copy link
Author

Yep. That is exactly what is going on. I really had no idea that the debugger automatically ignored everything in the virtual environment folder.

Id like to think I'm not the only person dumb enough to make this mistake. (If I am please just smile and close the ticket) ;)

Perhaps a warning or something if it main program is in an excluded directory would be useful.

I very much appreciate you taking the time and helping me. I also very much appreciate Microsoft making this excellent software available for free and providing support! Thank you.

@MarkBaggett
Copy link
Author

Oh.. And for your reference. The only thing I changed between "Not running the correct debugger" and "You are now running the correct debugger" was that I checked the two telemetry boxes. They were unchecked previously.

@int19h
Copy link
Contributor

int19h commented Apr 1, 2020

The debugger does try to report those breakpoints as not verified, with the message pointing at "justMyCode"... but this doesn't get surfaced prominently in UI. I think if the program were running long enough, you'd see the breakpoints look disabled, and hovering over them would show the message, but in this scenario, it's all over before you have a chance to even notice any of that.

I think we might also be printing that error in Debug Console at the bottom? But it doesn't get focus by default.

We could certainly diagnose this specific scenario - ${workspaceFolder} itself being the virtual env - and warn before you launch. This would be something to do on the extension side, though, since the debugger itself isn't aware of workspaces.

Can you file a separate issue on https://github.com/microsoft/vscode-python for better diagnostics?

@int19h int19h closed this as completed Apr 7, 2020
Sign up for free to subscribe to this conversation on GitHub. Already have an account? Sign in.
Labels
None yet
Projects
None yet
Development

No branches or pull requests

4 participants