Skip to content
New issue

Have a question about this project? Sign up for a free GitHub account to open an issue and contact its maintainers and the community.

By clicking “Sign up for GitHub”, you agree to our terms of service and privacy statement. We’ll occasionally send you account related emails.

Already on GitHub? Sign in to your account

VSCode automatically starts up debugger/inspector in built-in terminal ever since 1.47.0 update #102240

Closed
rajsinghUSA opened this issue Jul 11, 2020 · 4 comments
Assignees
Labels
debug Debug viewlet, configurations, breakpoints, adapter issues *duplicate Issue identified as a duplicate of another issue(s)

Comments

@rajsinghUSA
Copy link

rajsinghUSA commented Jul 11, 2020

  • VSCode Version: 1.47.0
  • OS Version: Windows 10 (1909) Build 18363.900

Steps to Reproduce:

A few days ago I updated my Surface Book 2 firmware (182.2107.139.0) through Windows Update and perhaps foolishly at the same time updating VSCode to 1.47.0. Afterwards, the VSCode installation seemed to have disappeared (at least the bin directory where the executable is kept disappeared), so it was recommended to me that I reinstall VSCode, which I did. My settings and tabs all appeared to be retained. However, for one of my projects, when VSCode starts up, it gives me this output in the terminal (without a subsequent prompt which would allow me to type):

Debugger listening on ws://127.0.0.1:55430/f3f20387-0605-4a39-b807-77f02bea362f
For help, see: https://nodejs.org/en/docs/inspector

My usual startup procedure for my project has been that I:

  1. Use WSL to navigate to the project directory I want to open, and then type code .
  2. I would then start up my server within the VSCode terminal (bash) by typing npm run serve (package.json has "serve": "vue-cli-service serve").

However, I obviously can't do this now that there's some debugger and inspector continuously running? Here's a screenshot showing my blank launch.json and the terminal:

debugger showing instead of command prompt

So I tried some more things.

  1. I ran cp -rf testsite testfrontend within WSL

  2. and then in the copied directory I deleted package-lock.json and node_modules

  3. I subsequently ran npm install

  4. I then started VSCode by running code . in the directory of the copied project within WSL

  5. When VSCode opened up, the terminal wasn't showing, so I showed it (Ctrl+`), and the following lines ran automatically on their own:
    vscode terminal startup

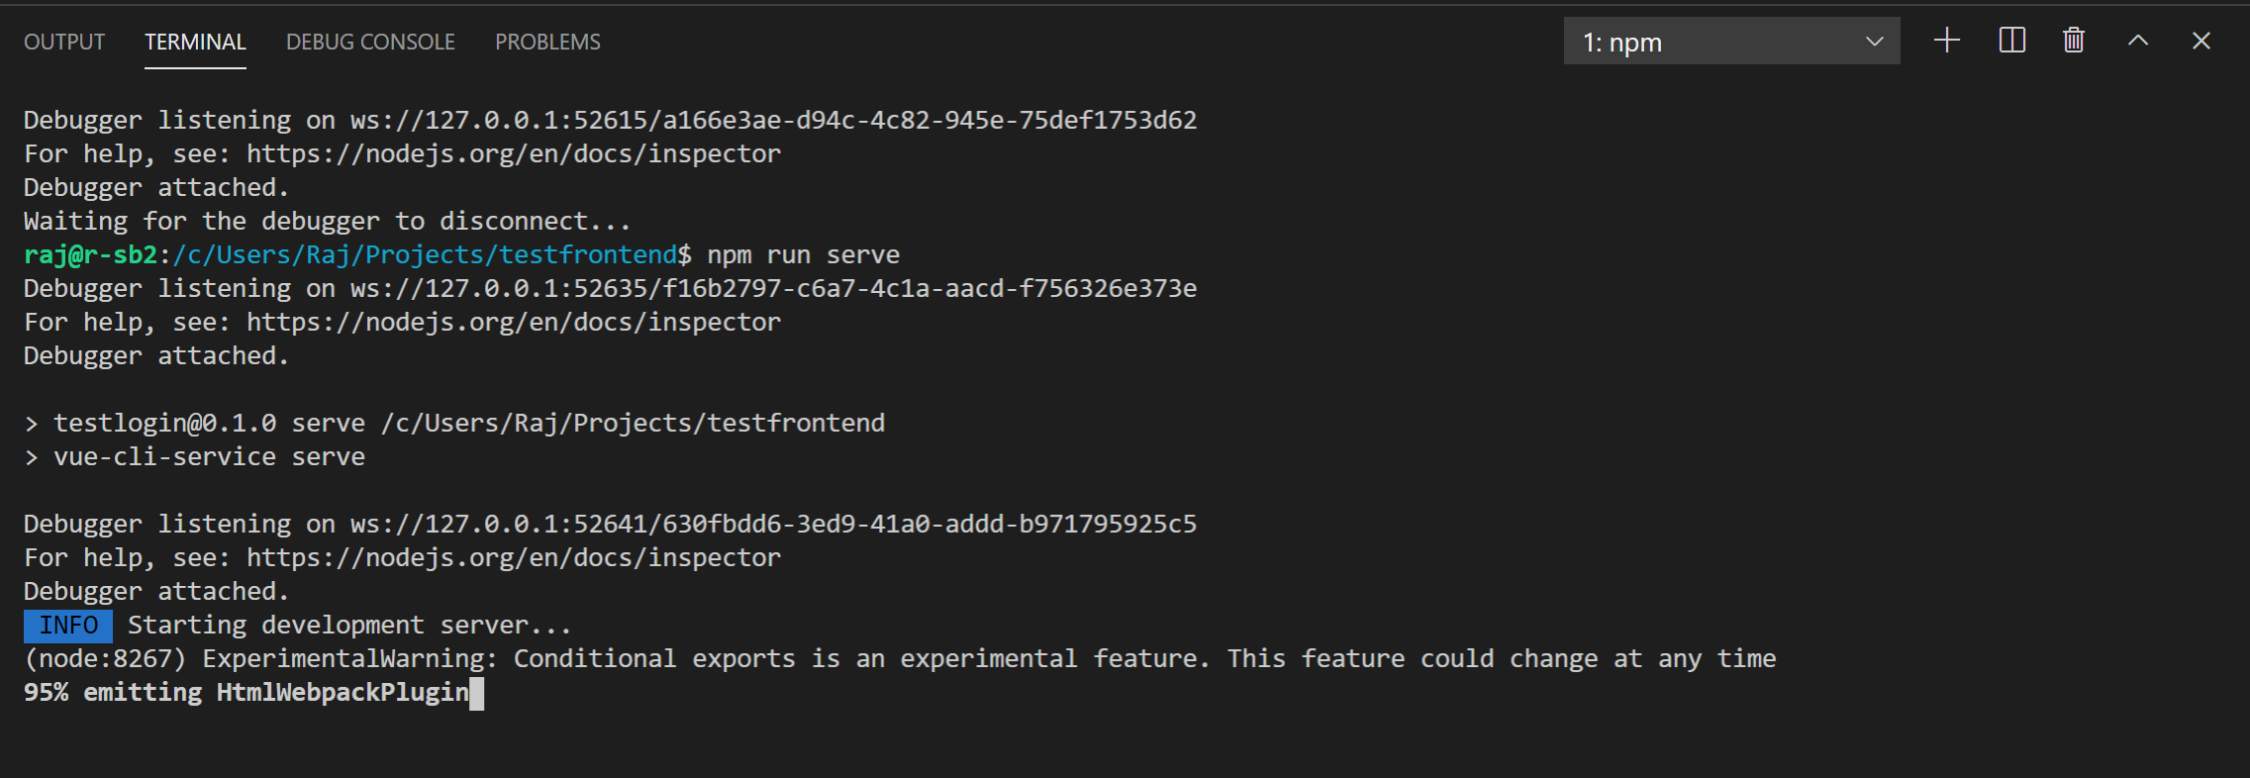
  6. Then I ran npm run serve, and the following happened (and it is stuck on this last line shown):
    stuck

  7. And with this message in the Debugger Console tab simultaneously:
    error

  8. Furthermore, if I close out of VSCode at this point, and reopen it again with code . from testfrontend (which is the newly cp'd directory I created in Step 1) in WSL, then I am back to square one with VSCode's terminal automatically showing this agani as soon as VSCode starts up:

Debugger listening on ws://127.0.0.1:55430/f3f20387-0605-4a39-b807-77f02bea362f
For help, see: https://nodejs.org/en/docs/inspector

I should mention that I don't get this error or any of the other aforementioned issues in the following two scenarios:

  1. when I run npm run serve directly from WSL
  2. I also don't get the aforementioned issues if I click the green WSL: Ubuntu button at the bottom left and then choose Remote-WSL: New Window and then run npm run serve:
    new window

Can someone please tell me how to fix this? I have no idea what has gone wrong, but it only seems to happen with this particular project.

Does this issue occur when all extensions are disabled?: n/a because I am using WSL, which requires extensions

@weinand weinand assigned connor4312 and unassigned weinand and Tyriar Jul 11, 2020
@weinand weinand added the debug Debug viewlet, configurations, breakpoints, adapter issues label Jul 11, 2020
@connor4312
Copy link
Member

This is the same as #102057

You can fix this for the moment by setting debug.node.autoAttach to disabled, then reloading the window / reopening the terminal.

/duplicate

@rajsinghUSA
Copy link
Author

I ended up starting VSCode with code --disable-extensions . from my WSL, and just ignoring all the error messages and shutting down VSCode. Afterwards, when I started VSCode normally from the project directory via code ., everything went back to working as normal, where my npm run myscript and everything else worked exactly as expected.

Though I'm unclear how debug.node.autoAttach would provide a solution for the error message I had shown, I anyway didn't get to try your solution this time, but I'll keep it in mind if something similarly screwy happens in the future.

Thanks

@jcbeck37
Copy link

Like @rajsinghUSA , the above fix (debug.node.autoAttach) did not work for me, but his suggested fix did work for me.

@github-actions github-actions bot locked and limited conversation to collaborators Aug 25, 2020
Sign up for free to subscribe to this conversation on GitHub. Already have an account? Sign in.
Labels
debug Debug viewlet, configurations, breakpoints, adapter issues *duplicate Issue identified as a duplicate of another issue(s)
Projects
None yet
Development

No branches or pull requests

6 participants
@weinand @Tyriar @connor4312 @jcbeck37 @rajsinghUSA and others