You signed in with another tab or window. Reload to refresh your session.You signed out in another tab or window. Reload to refresh your session.You switched accounts on another tab or window. Reload to refresh your session.Dismiss alert
{{ message }}
This repository has been archived by the owner on Oct 25, 2022. It is now read-only.
Describe the bug
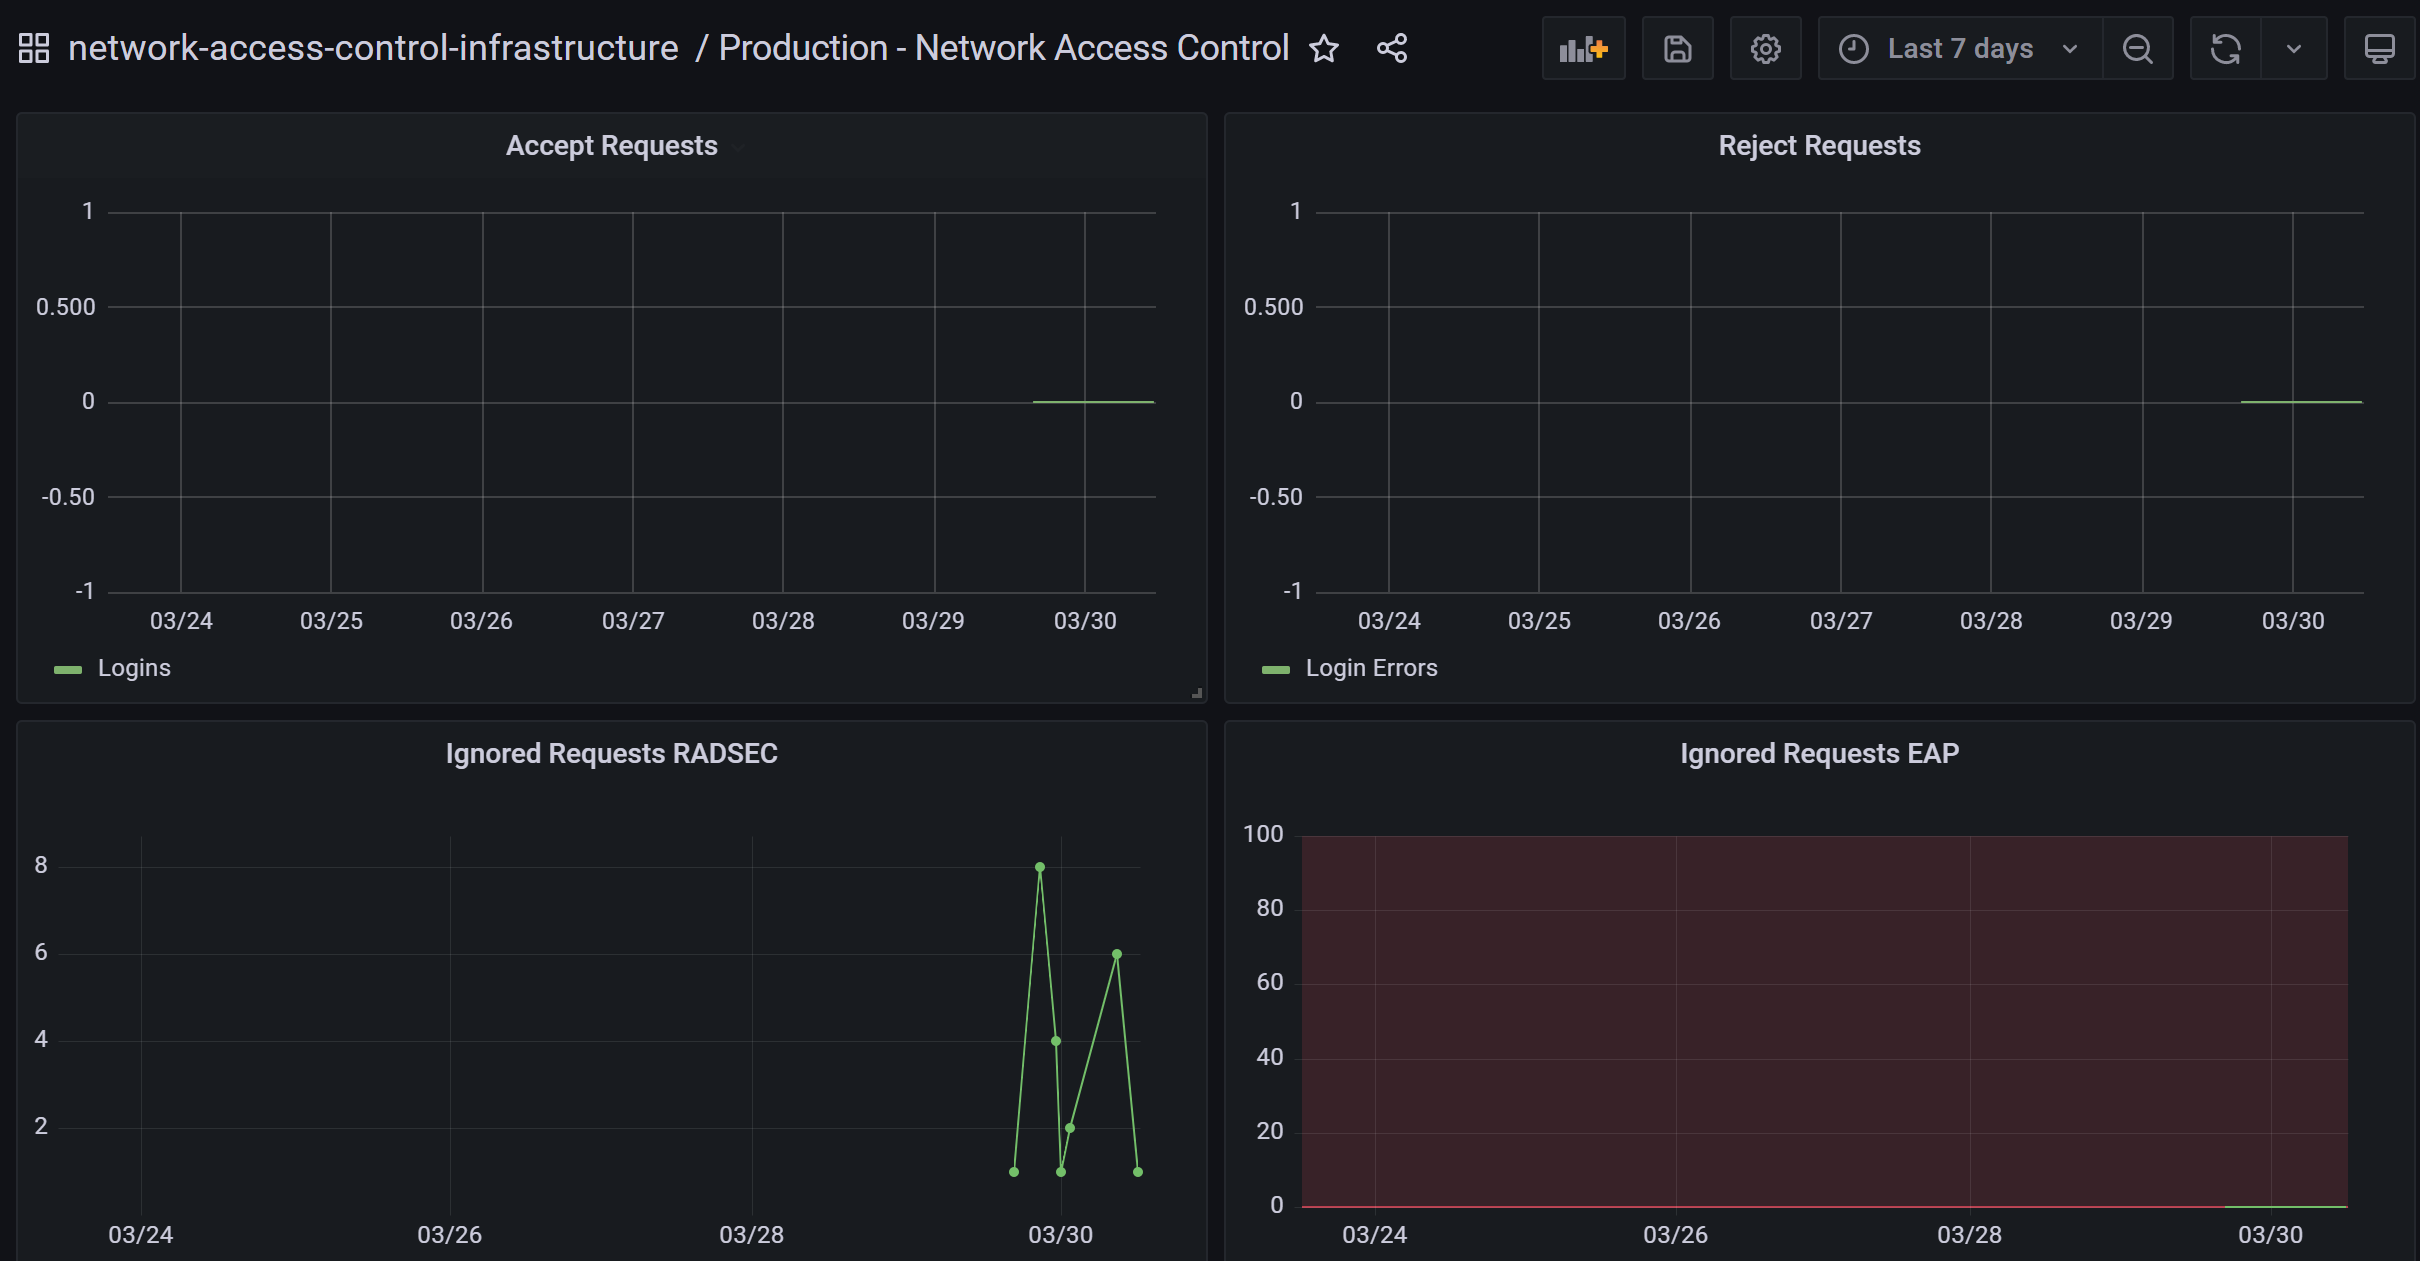
There appears to be no data held longer than 24 hours for custom metrics in grafana.
To Reproduce
Steps to reproduce the behavior:
Expected behavior
No data is seen in custom metric graphs when the time period is > 24 hours.
Screenshots

Desktop (please complete the following information):
Smartphone (please complete the following information):
Additional context
Add any other context about the problem here.
The text was updated successfully, but these errors were encountered: