-
Notifications
You must be signed in to change notification settings - Fork 7
/
Copy pathdomb-napari.json
228 lines (228 loc) · 21.9 KB
/
domb-napari.json
1
2
3
4
5
6
7
8
9
10
11
12
13
14
15
16
17
18
19
20
21
22
23
24
25
26
27
28
29
30
31
32
33
34
35
36
37
38
39
40
41
42
43
44
45
46
47
48
49
50
51
52
53
54
55
56
57
58
59
60
61
62
63
64
65
66
67
68
69
70
71
72
73
74
75
76
77
78
79
80
81
82
83
84
85
86
87
88
89
90
91
92
93
94
95
96
97
98
99
100
101
102
103
104
105
106
107
108
109
110
111
112
113
114
115
116
117
118
119
120
121
122
123
124
125
126
127
128
129
130
131
132
133
134
135
136
137
138
139
140
141
142
143
144
145
146
147
148
149
150
151
152
153
154
155
156
157
158
159
160
161
162
163
164
165
166
167
168
169
170
171
172
173
174
175
176
177
178
179
180
181
182
183
184
185
186
187
188
189
190
191
192
193
194
195
196
197
198
199
200
201
202
203
204
205
206
207
208
209
210
211
212
213
214
215
216
217
218
219
220
221
222
223
224
225
226
227
228
{
"name": "domb-napari",
"display_name": "domb-napari",
"visibility": "public",
"icon": "",
"categories": [],
"schema_version": "0.2.1",
"on_activate": null,
"on_deactivate": null,
"contributions": {
"commands": [
{
"id": "domb-napari.split_channels_widget",
"title": "Multichannel stack preprocessing",
"python_name": "domb_napari._widget:split_channels",
"short_title": null,
"category": null,
"icon": null,
"enablement": null
},
{
"id": "domb-napari.dw_registration_widget",
"title": "Dual-view stack registration",
"python_name": "domb_napari._widget:dw_registration",
"short_title": null,
"category": null,
"icon": null,
"enablement": null
},
{
"id": "domb-napari.split_sep_widget",
"title": "SEP image preprocessing",
"python_name": "domb_napari._widget:split_sep",
"short_title": null,
"category": null,
"icon": null,
"enablement": null
},
{
"id": "domb-napari.e_app_widget",
"title": "E-FRET estimation",
"python_name": "domb_napari._widget:e_app_calc",
"short_title": null,
"category": null,
"icon": null,
"enablement": null
},
{
"id": "domb-napari.der_series_widget",
"title": "Red-green series",
"python_name": "domb_napari._widget:der_series",
"short_title": null,
"category": null,
"icon": null,
"enablement": null
},
{
"id": "domb-napari.up_mask_calc_widget",
"title": "Up masking",
"python_name": "domb_napari._widget:up_mask_calc",
"short_title": null,
"category": null,
"icon": null,
"enablement": null
},
{
"id": "domb-napari.mask_calc_widget",
"title": "Intensity masking",
"python_name": "domb_napari._widget:mask_calc",
"short_title": null,
"category": null,
"icon": null,
"enablement": null
},
{
"id": "domb-napari.labels_profiles_set_widget",
"title": "ROIs profiles",
"python_name": "domb_napari._widget:labels_profile_line",
"short_title": null,
"category": null,
"icon": null,
"enablement": null
},
{
"id": "domb-napari.labels_multi_profile_widget",
"title": "Multiple img stat profiles",
"python_name": "domb_napari._widget:labels_multi_profile_stat",
"short_title": null,
"category": null,
"icon": null,
"enablement": null
},
{
"id": "domb-napari.multi_labels_profile_widget",
"title": "Multiple labels stat profiles",
"python_name": "domb_napari._widget:multi_labels_profile_stat",
"short_title": null,
"category": null,
"icon": null,
"enablement": null
},
{
"id": "domb-napari.dot_mask_widget",
"title": "Dot-patterns masking",
"python_name": "domb_napari._widget:dot_mask_calc",
"short_title": null,
"category": null,
"icon": null,
"enablement": null
}
],
"readers": null,
"writers": null,
"widgets": [
{
"command": "domb-napari.dw_registration_widget",
"display_name": "Dual-view stack registration",
"autogenerate": false
},
{
"command": "domb-napari.split_channels_widget",
"display_name": "Multichannel stack preprocessing",
"autogenerate": false
},
{
"command": "domb-napari.der_series_widget",
"display_name": "Red-green series",
"autogenerate": false
},
{
"command": "domb-napari.e_app_widget",
"display_name": "E-FRET estimation",
"autogenerate": false
},
{
"command": "domb-napari.split_sep_widget",
"display_name": "SEP preprocessing",
"autogenerate": false
},
{
"command": "domb-napari.dot_mask_widget",
"display_name": "Dot-patterns masking",
"autogenerate": false
},
{
"command": "domb-napari.up_mask_calc_widget",
"display_name": "Up masking",
"autogenerate": false
},
{
"command": "domb-napari.mask_calc_widget",
"display_name": "Intensity masking",
"autogenerate": false
},
{
"command": "domb-napari.labels_profiles_set_widget",
"display_name": "ROIs profiles",
"autogenerate": false
},
{
"command": "domb-napari.labels_multi_profile_widget",
"display_name": "Multiple img stat profiles",
"autogenerate": false
},
{
"command": "domb-napari.multi_labels_profile_widget",
"display_name": "Multiple labels stat profiles",
"autogenerate": false
}
],
"sample_data": null,
"themes": null,
"menus": {},
"submenus": null,
"keybindings": null,
"configuration": []
},
"package_metadata": {
"metadata_version": "2.1",
"name": "domb-napari",
"version": "0.3.0",
"dynamic": null,
"platform": null,
"supported_platform": null,
"summary": "napari plugin for analyzing fluorescence-labeled proteins redistribution",
"description": "domb-napari\n===========\n\n[](https://stand-with-ukraine.pp.ua)\n\n[](https://napari-hub.org/plugins/domb-napari)\n\n\n<!--  -->\n\n__napari Toolkit of Department of Molecular Biophysics <br /> Bogomoletz Institute of Physiology of NAS of Ukraine, Kyiv, Ukraine__\n\nThis plugin offers widgets specifically designed to analyze the redistribution of fluorescence-labeled proteins in widefield epifluorescence time-lapse acquisitions. It is particularly useful for studying various phenomena, including:\n- Calcium-dependent translocation of neuronal calcium sensors.\n- Synaptic receptor traffic during long-term plasticity induction.\n- Membrane protein tracking.\n\n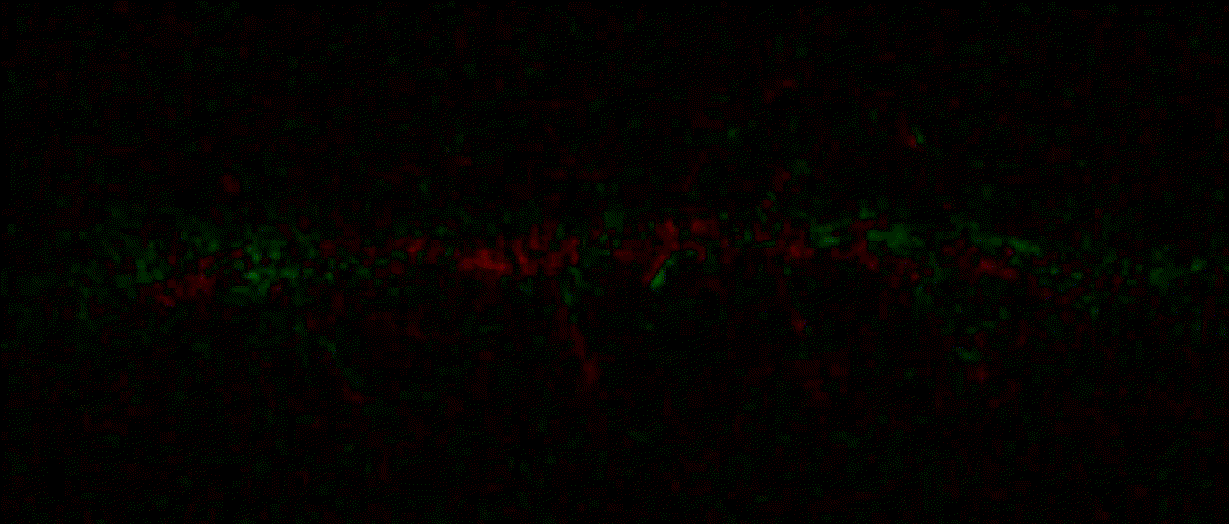\n__Hippocalcin (neuronal calcium sensor) redistributes in dendritic branches upon NMDA application__\n\n\n---\n\n\n## Detection of fluorescence redistributions\nA set of widgets designed for preprocessing multispectral image stacks and detecting redistributions in fluorescence intensity. These widgets specifically analyze differential \"red-green\" image series to identify changes in fluorescence intensity.\n\nInspired by [Dovgan et al., 2010](https://pubmed.ncbi.nlm.nih.gov/20704590/) and [Osypenko et al., 2019](https://www.sciencedirect.com/science/article/pii/S0969996119301974?via%3Dihub).\n\n\n### Dual-view stack registration\nRegistration of four-channel image stacks, including two excitation wavelengths and two emission pathbands, acquired with a dual-view beam splitter. This setup detects different spectral pathbands using distinct sides of the CCD matrix.\n\n- `offset img` - input for a four-channel time-lapse image stack.\n- `reference img` - an optional four-channel reference image (e.g., fluorescence beads image), used for offset estimation if `use reference img` is selected.\n- `input crop` - number of pixels that will be deleted from each side of input stack frames to discard misalignment artifacts from the dual-view system.\n- `output crop` - number of pixels that will be deleted from each side of output stack frames to discard registration artifacts.\n\n\n### Multichannel stack preprocessing\n- `stack order` - represents the order of axes in the input data array: T (time), C (color), X, and Y (image dimensions). If the input image stack has four dimensions (time, channel, x-axis, y-axis), channels will be split into individual three-dimensional images (time, x-axis, y-axis), each labeled with the `_ch%index%` suffix.\n- `median filter` - provides frame-by-frame image smoothing with a kernel of size specified in `median kernel`.\n- `background subtraction` - compensates for background fluorescence intensity. Background intensity is estimated frame by frame as the 0.5 percentile of frame intensity.\n- If the `photobleaching correction` option is selected, the image will undergo correction using either an exponential (method `exp`) or bi-exponential (method `bi_exp`) fitting.\n- Image stacks can be cropped according to start and stop indexes specified in `frames range` if `drop frames` is selected.\n\n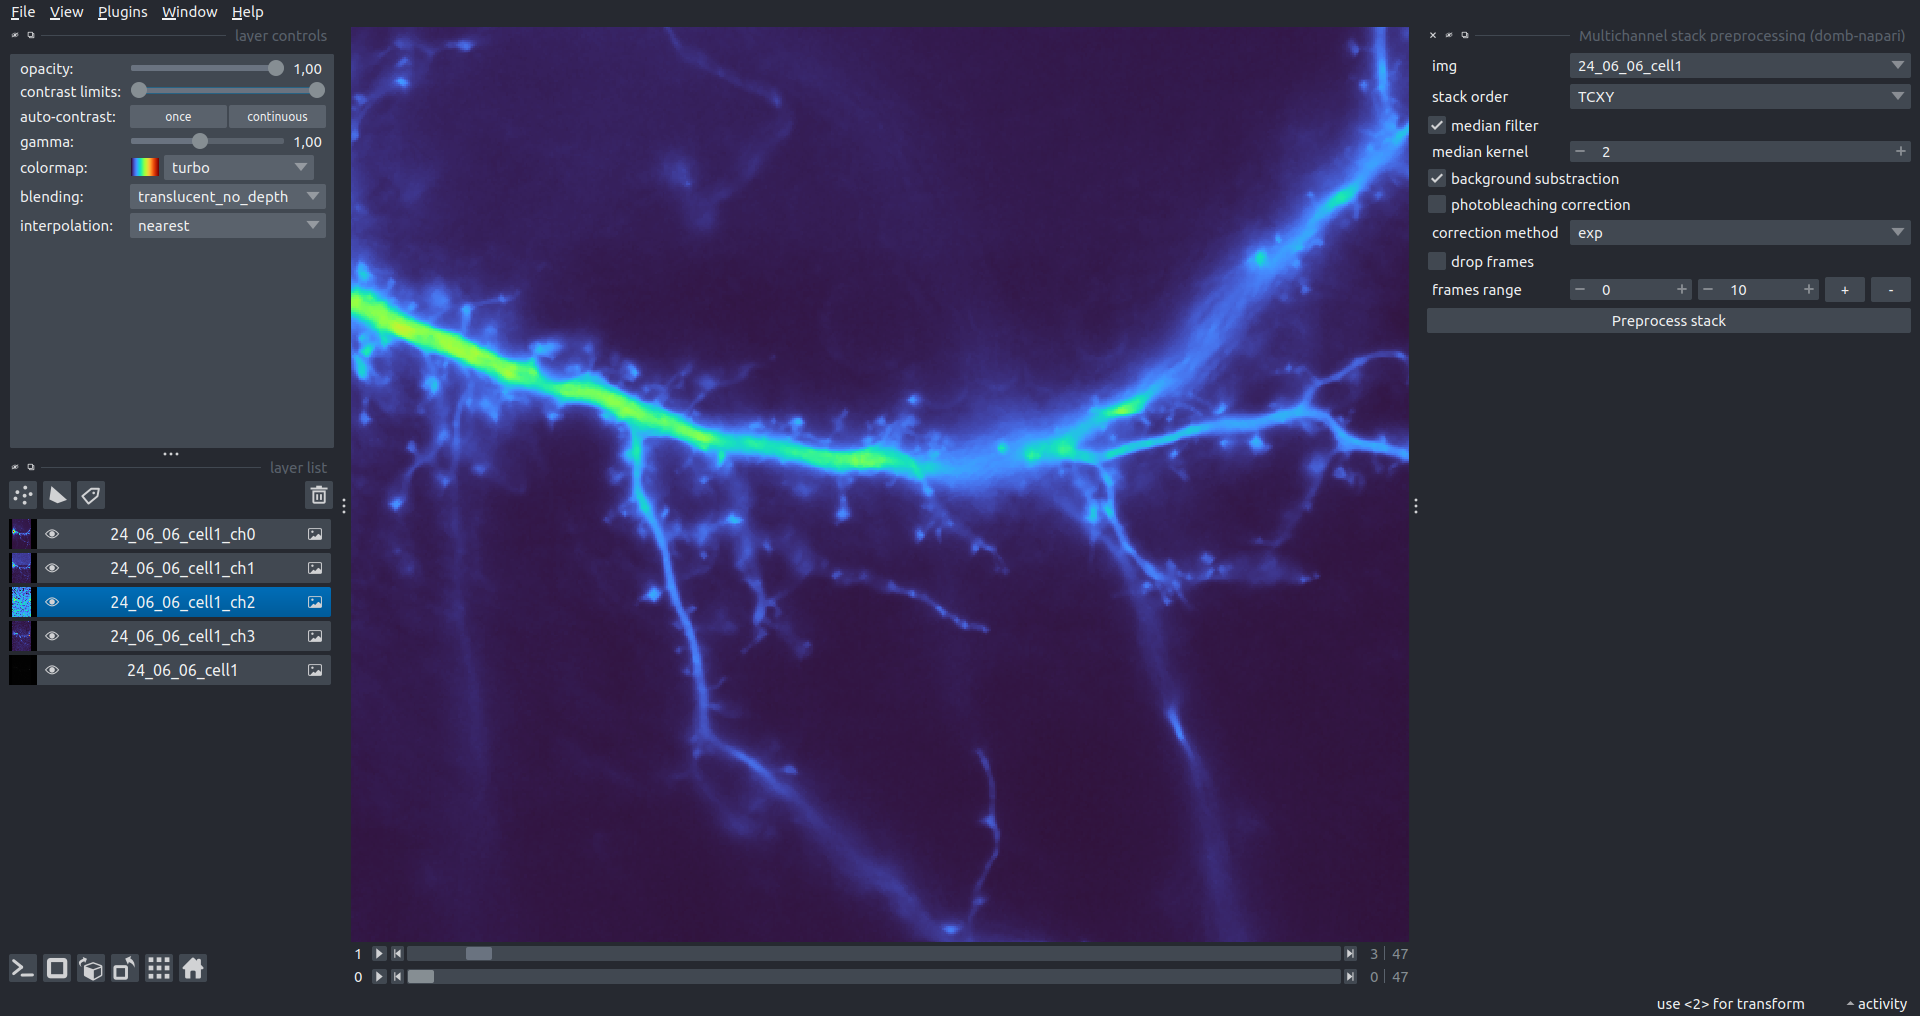\n\n\n### Red-green series\nPrimary method for detecting fluorescence-labeled targets redistribution. This widget returns a series of differential images, each representing the intensity difference between the current frame and the previous one, output image labeled with the `_red-green` suffix.\n\nParameters:\n\n- `left frames` - specifies the number of previous frames used for pixel-wise averaging.\n- `space frames` - determines the number of frames between the last left frame and the first right frame.\n- `right frames` - specifies the number of subsequent frames used for pixel-wise averaging.\n\n`normalize by int` function normalizes the differential images relative to the absolute intensity of the input image stack, which helps to reduce background noise amplitude.\n\nIf `save MIP` is selected, the maximal intensity projection (MIP) of the differential image stack will be saved with the `_red-green-MIP` suffix.\n\n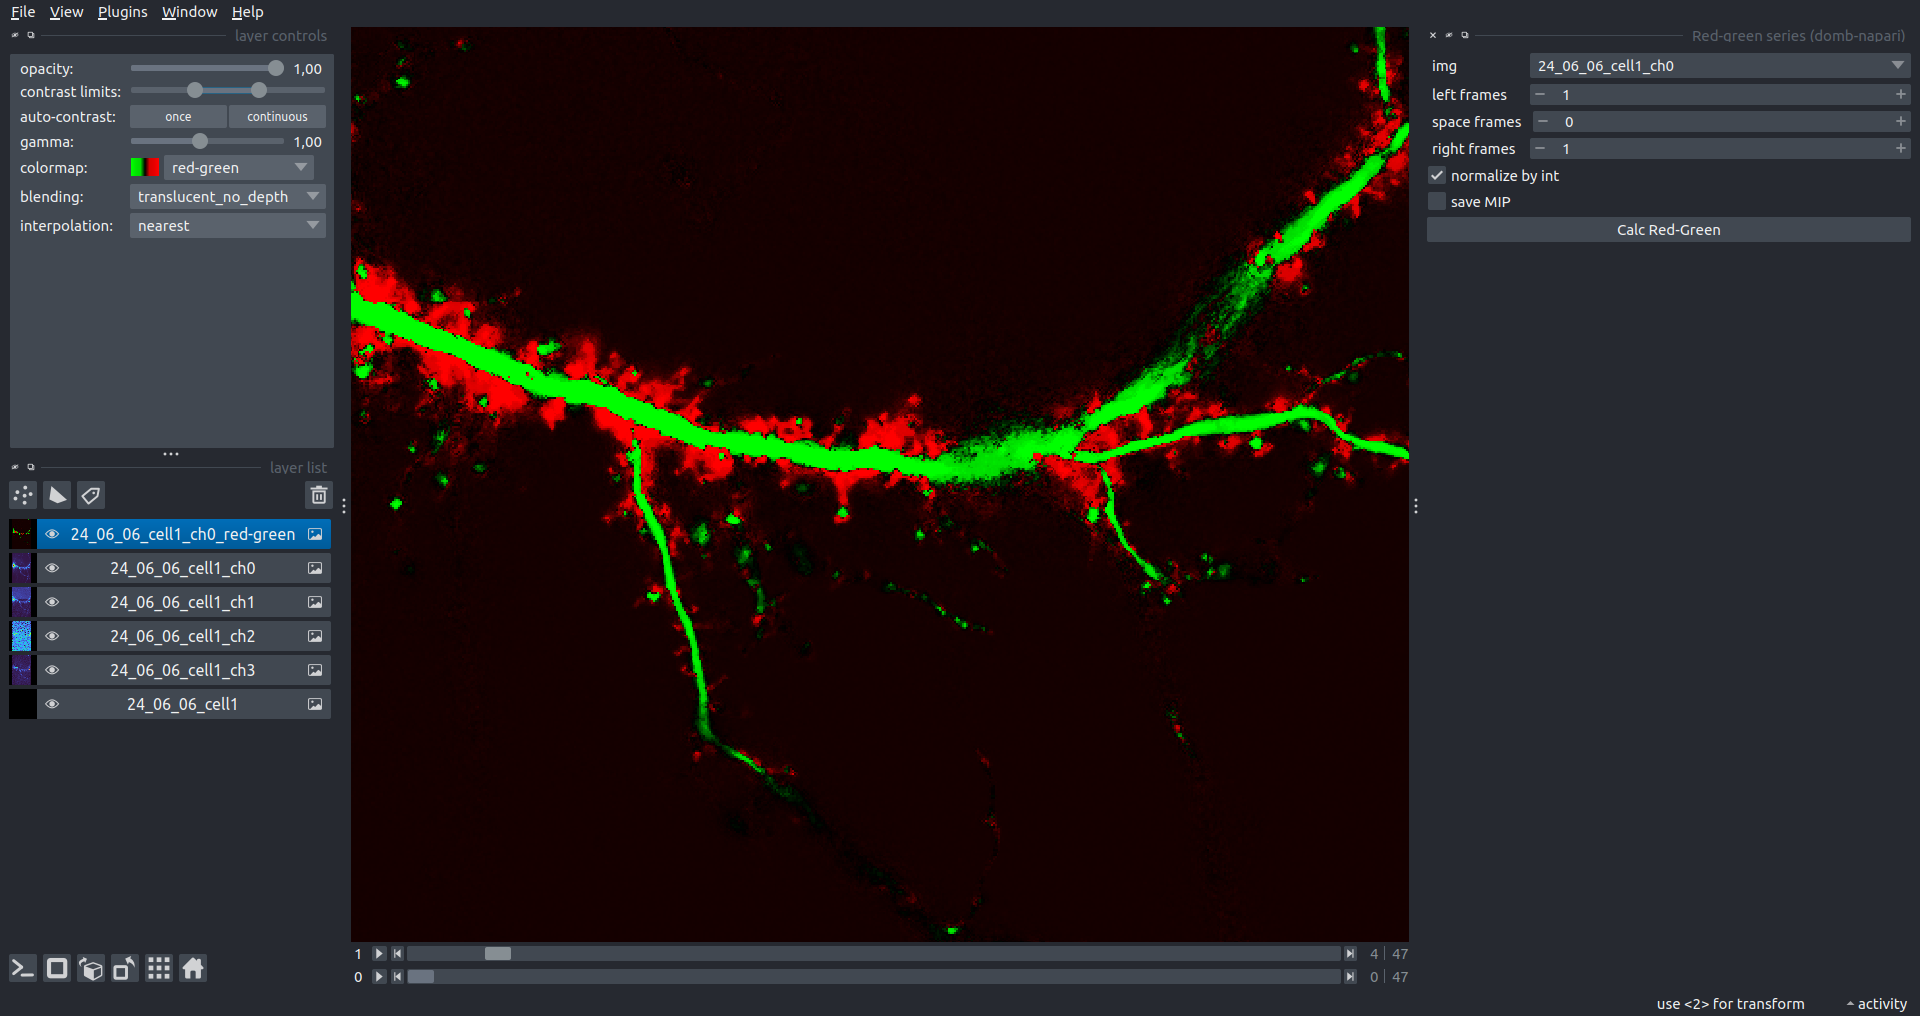\n\n---\n\n## Masking\n### Dots patterns masking\nCreates labels for bright dot elements on an image, such as pre- and postsynaptic fluorescence markers (e.g., Bassoon/Synaptobrevin for presynapses, PSD-95/Homer for postsynapses, etc.). It returns a labels layer with the `_dots-labels` suffix.\n\nThe widget detects the location on the MIP (Maximum Intensity Projection) of the input time series image and applies simple round masks to each detected dot. Watershed segmentation is then used to prevent the merging of overlapping masks.\n\nParameters:\n\n- `background level` - Background level for filtering out low-intensity elements. This is specified as a percentile of the MIP intensity.\n- `detection level` - Minimum intensity of dots, specified as a percentile of the MIP's maximum intensity.\n- `mask diameter` - Diameter in pixels for the round mask of each individual dot.\n- `minimal distance` - Minimum distance in pixels between the centers of individual round masks.\n\n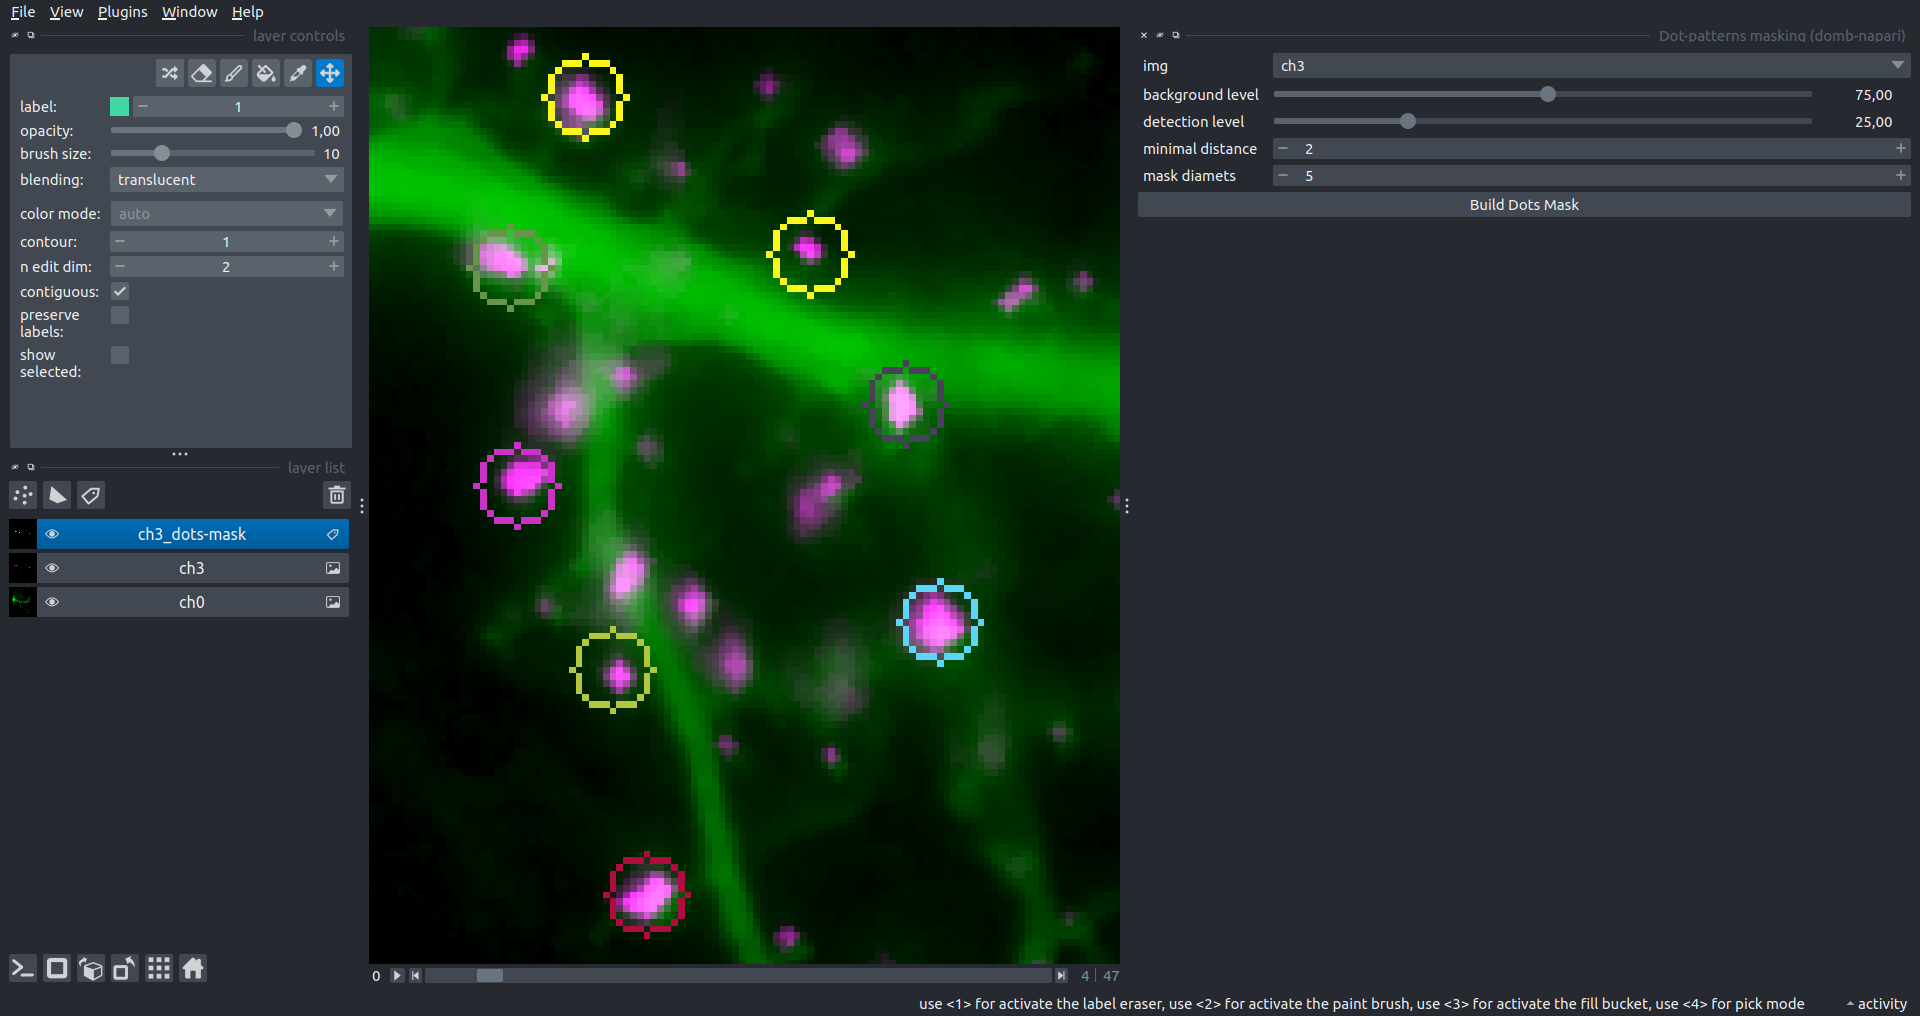\n__Hippocalcin (green) and PSD95 (magents) in dendritic branches__\n\n\n### Up masking\nGenerates labels for regions with high intensity based on raw or -red-green images. Returns a labels layer with the `_up-labels` suffix.\n\nThe widget provides two detection modes:\n\n- Global masking with a fixed threshold for the entire image.\n- In-ROIs masking with a loop over individual ROIs in the input `ROIs mask` with separate detections.\n\nParameters:\n\n- `det frame index` - index of the frame from the input image used for label detection.\n- `det th` - treshold value for detecting bright sites, where the intensity on the selected frame is normalized in the range of -1 to 0.\n- `in ROIs det` - option for activating in-ROIs masking.\n- `in ROIs det method` - method for in-ROIs masking; otsu provides simple Otsu thresholding, while the threshold method is identical to global detection on nomilized detection frame.\n- `in_ROIs_det_th_corr` - caling factor for the det th threshold value for in-ROIs masking.\n- `final opening fp` - footprint size in pixels for mask filtering using morphological opening (disabled if set to 0).\n- `final dilation fp` - footprint size in pixels for mask morphological dilation (disabled if set to 0).\n- `save total up mask` - if selected, a total up mask (containing all ROIs) will be created with the _up-mask suffix.\n\n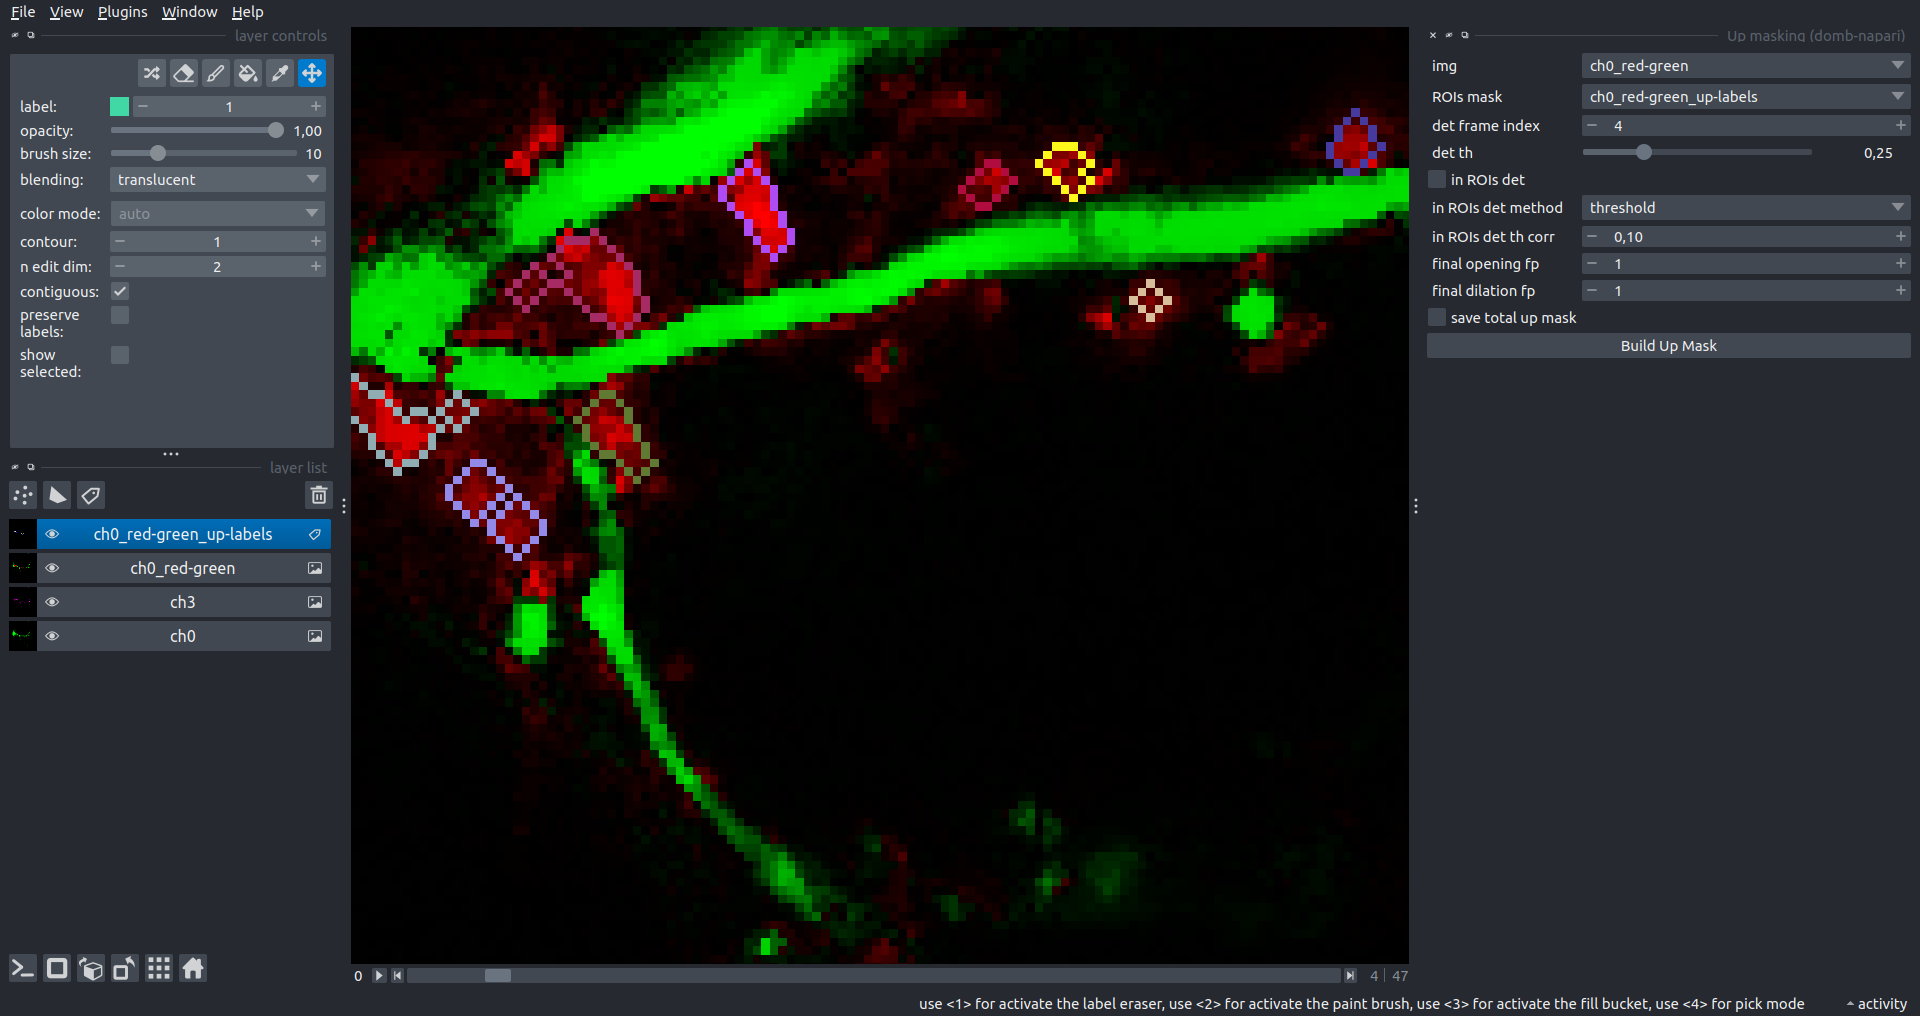\n__Gplobal up labels__\n\nThe In-ROIs masking option can be particularly useful for co-localization detection. By applying a broad reference mask to several target images, you can create more precise labels for ROIs in specified cell compartments. The following examples demonstrate the detection of mutual locations for static PSD-95 enriched sites (postsynaptic membranes) and HPCA translocation sites only in the vicinity of synapses, using `_dots-labels` for PSD95-mRFP images.\n\n_Note: In the In-ROIs masking mode, labels of detected sites correspond to the matching labels from the input ROIs mask._\n\nIn-ROIs masking (reference)|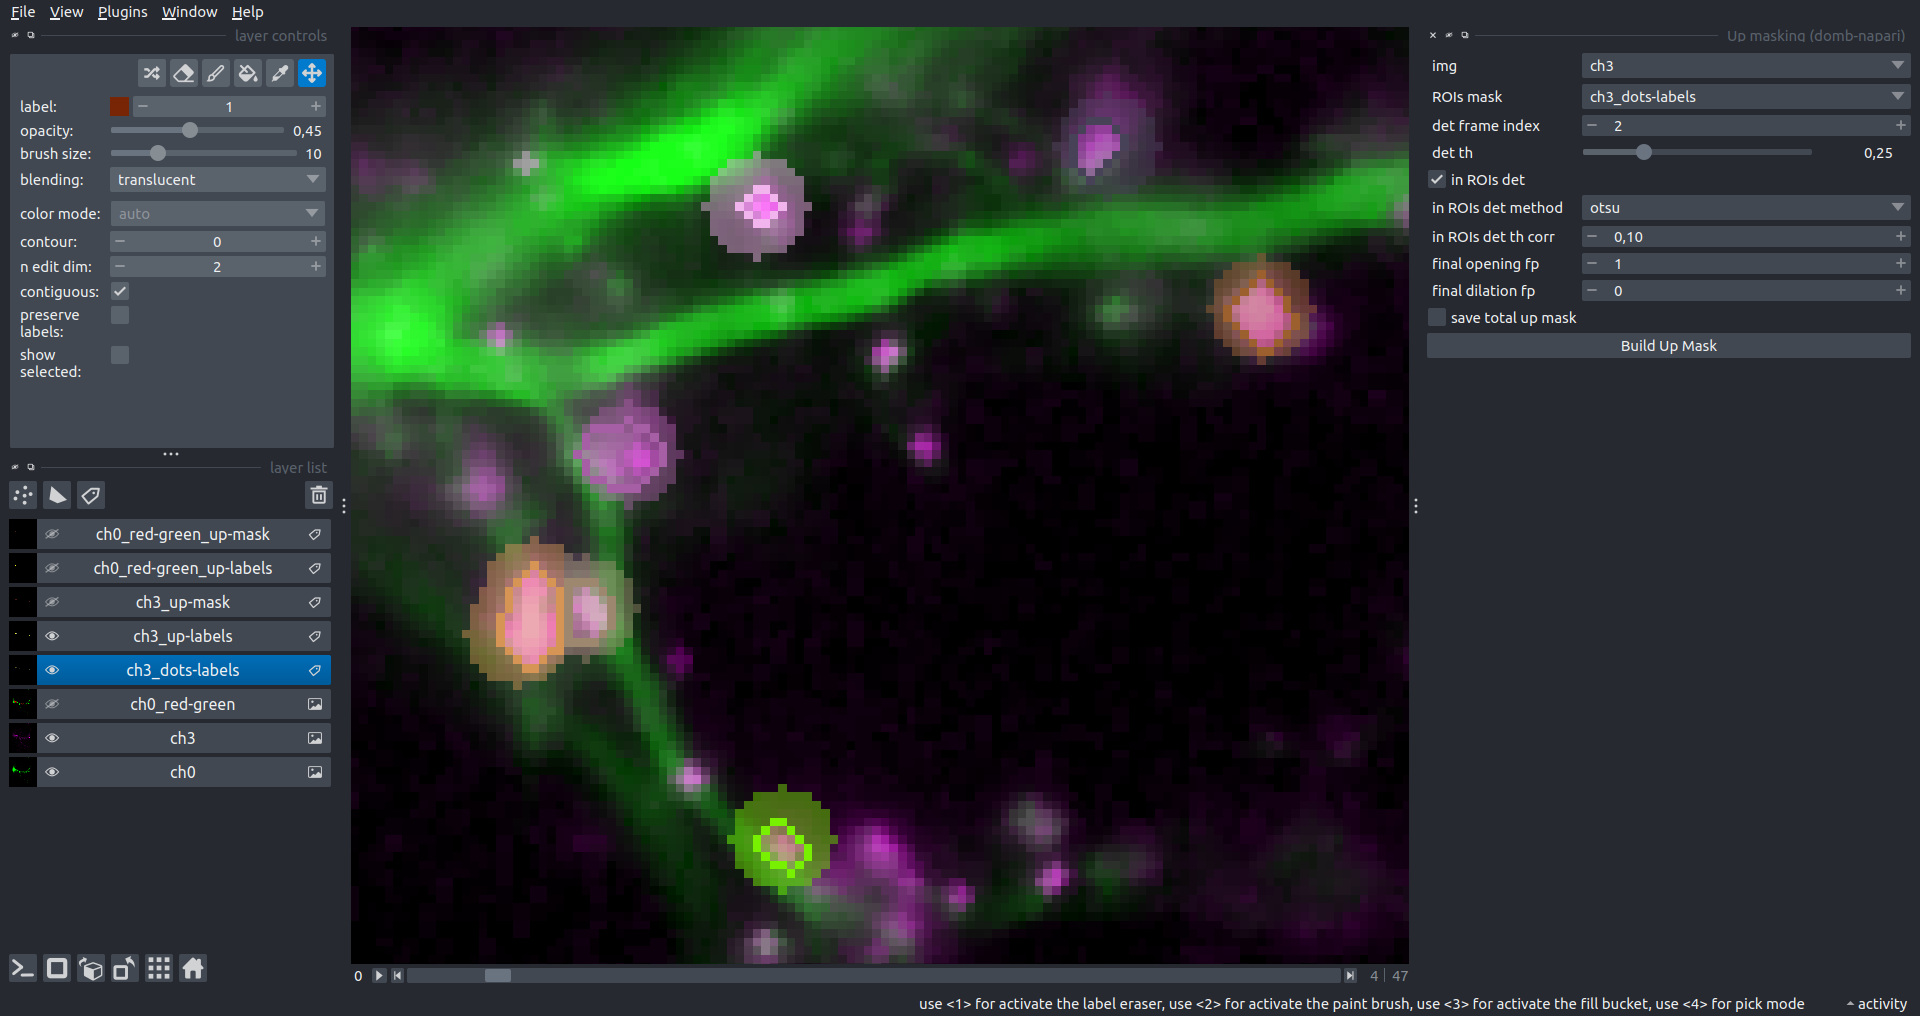\n:------------------:|:-------------------------:\n__In-ROIs maskin (translocation)__|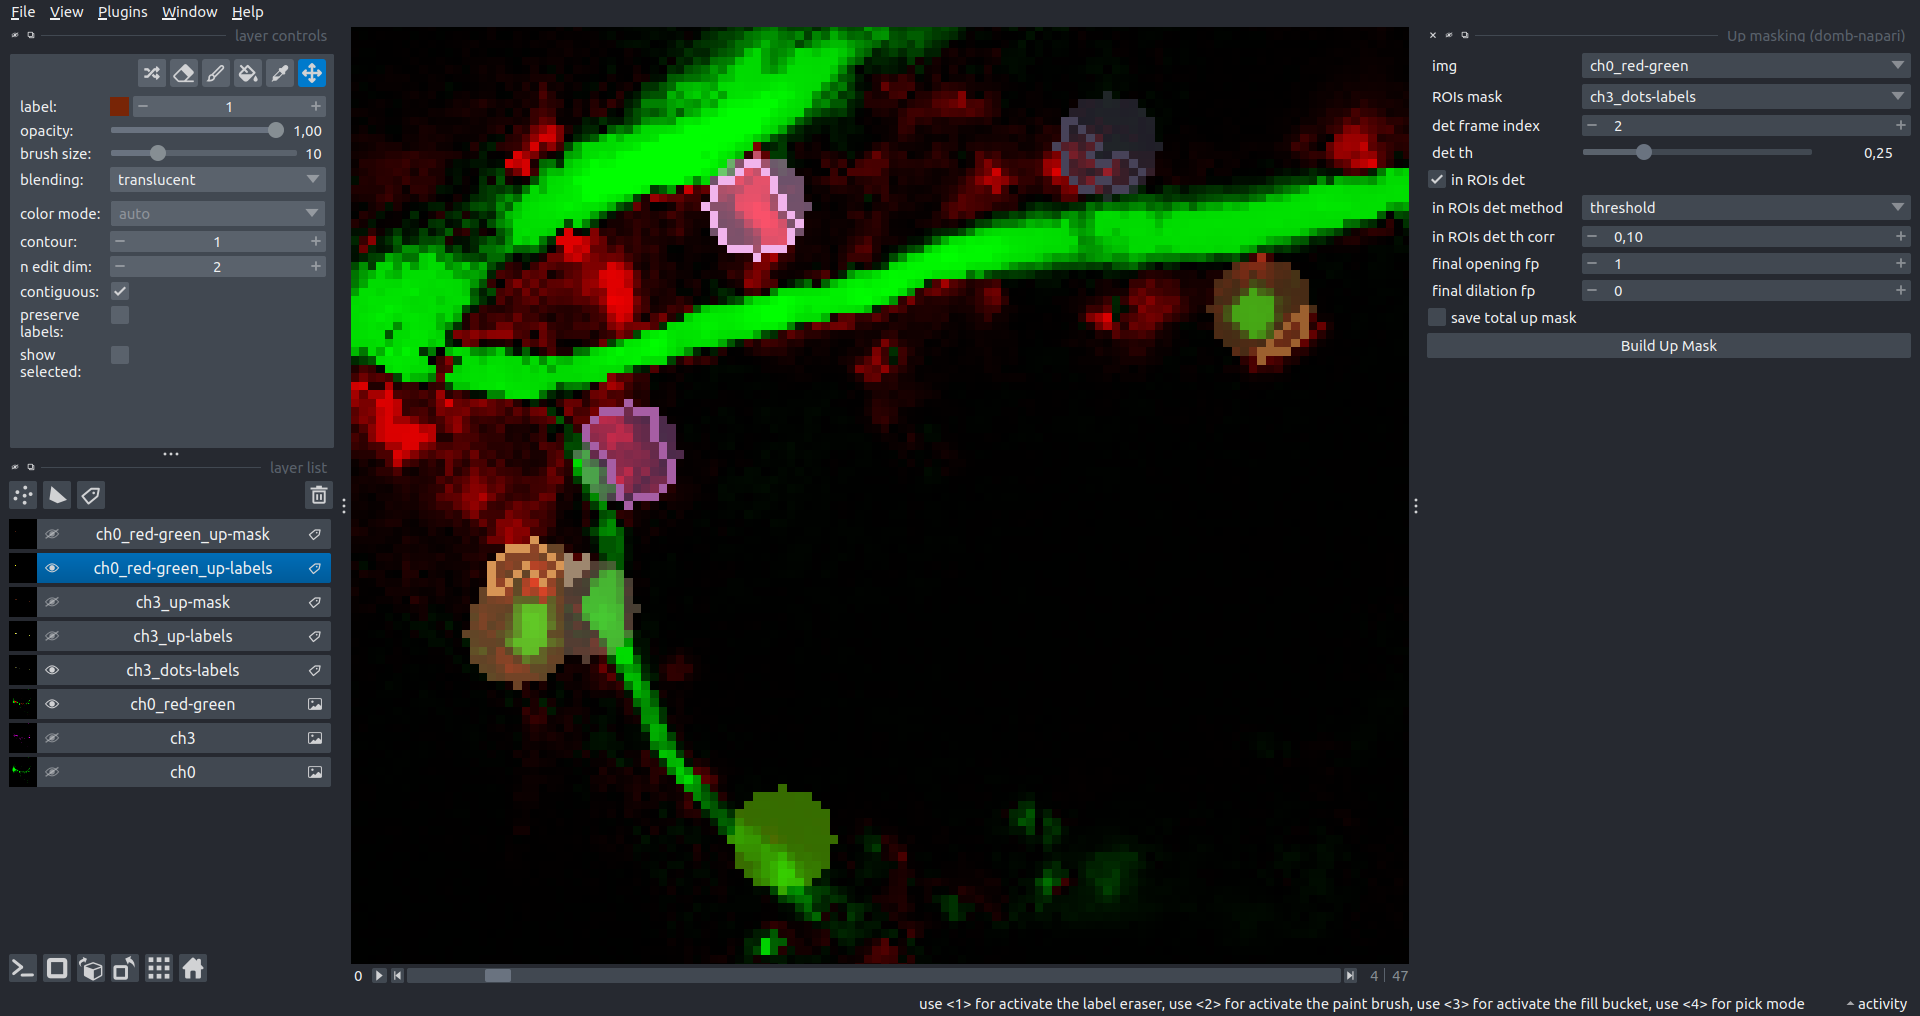\n__Masks overlay__|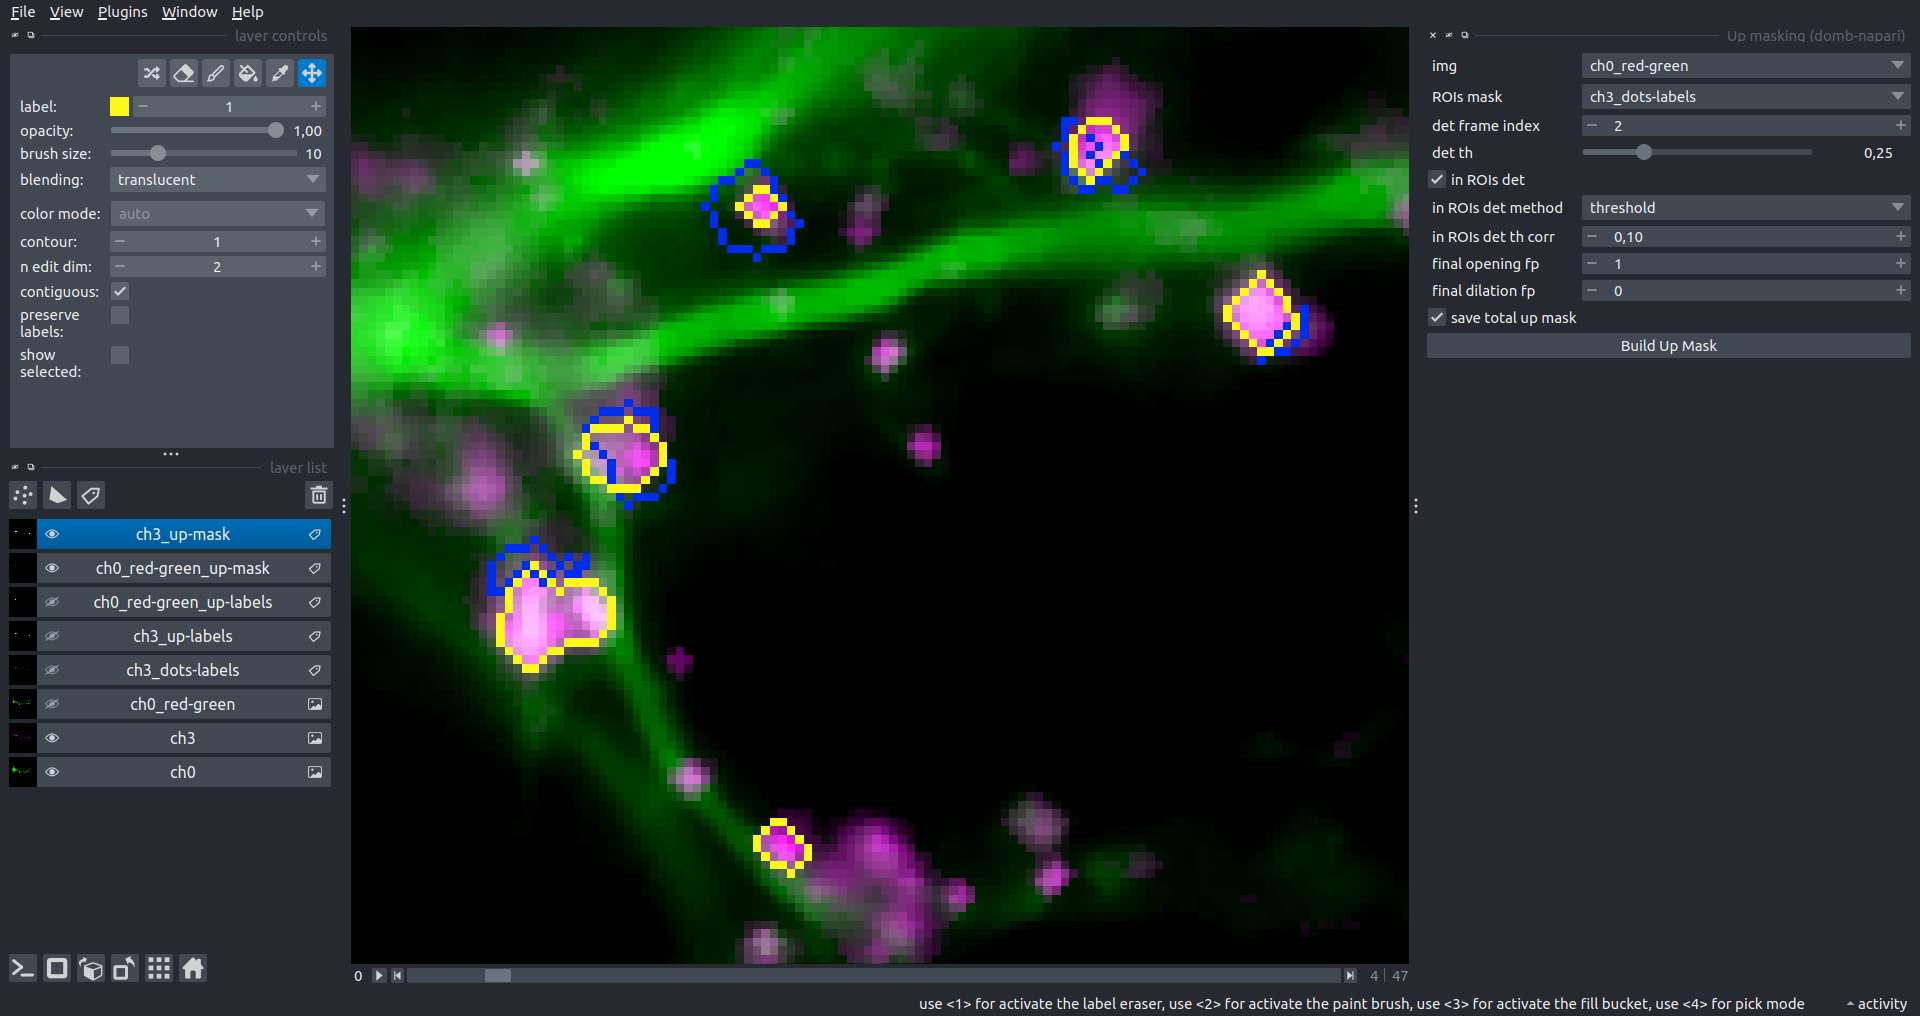\n\n\n### Intensity masking\nExtension of __Up Masking__ widget. Detects regions with increasing (`masking mode` - `up`) or decreasing (`masking mode` - `down`) intensity in `-red-green` images. Returns a labels layer with either `_up-labels` or `_down-labels` suffix, depending on the mode.\n\n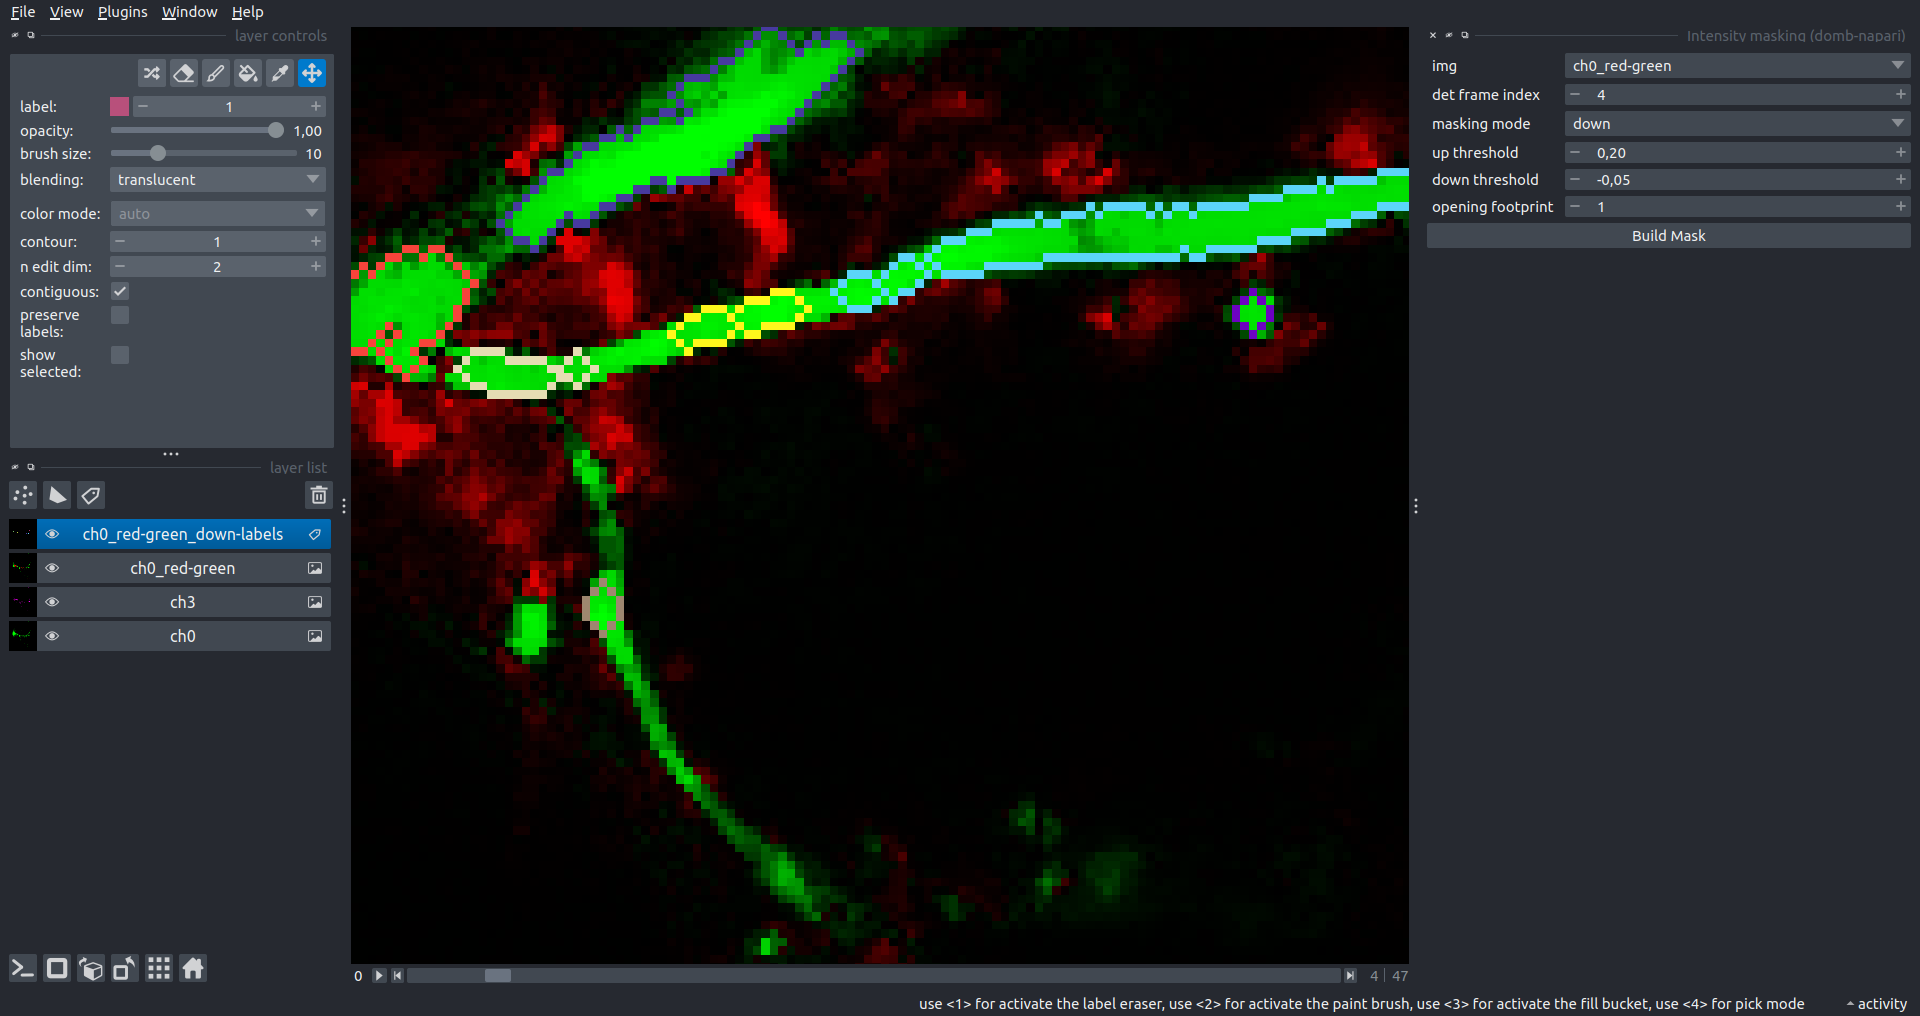\n\n---\n\n## FRET detection\nWidgets for detection and analysis of F\u00f6rster resonance energy transfer multispectral image stacks.\n\nBased on [Zal and Gascoigne, 2004](https://pubmed.ncbi.nlm.nih.gov/15189889/), [Chen et al., 2006](https://pubmed.ncbi.nlm.nih.gov/16815904/) and [Kamino et al., 2023](https://pubmed.ncbi.nlm.nih.gov/37014867/).\n\n\n### E-FRET estimation\nE-FRET estimation with 3-cube approach.\n\nThis method utilizes default values for `a` and `d` coefficients and the `G`-factor, optimized for the pair EYFP and ECFP in our experimental setup:\n- Microscope Olympus IX71\n- Cube Chroma 69008\n- Dual-view system with Chroma 505DCXR beam splitter\n- Donor excitation wavelength 435 nm\n- Acceptor excitation wavelength 505 nm\n\nParameters:\n\n- `DD img` - donor emission channel image acquired with the donor excitation wavelength.\n- `AD img` - acceptor emission channel image acquired with the donor excitation wavelength.\n- `AA img` - acceptor emission channel image acquired with the acceptor excitation wavelength.\n- `output type` - type of output image: sensitized emission (`Fc`), apparent FRET efficiency (`Eapp`), or FRET efficiency with photobleaching correction (`Ecorr`).\n\nIf the `save normalized` option is selected, an additional image will be saved. This image is normalized to the absolute intensity of the `AA img`, which results in reduced background noise amplitude.\n\n_Note: normalized images are useful for visual control and mask building only; they are not representative for quantitative analysis._\n\nRaw Eapp| 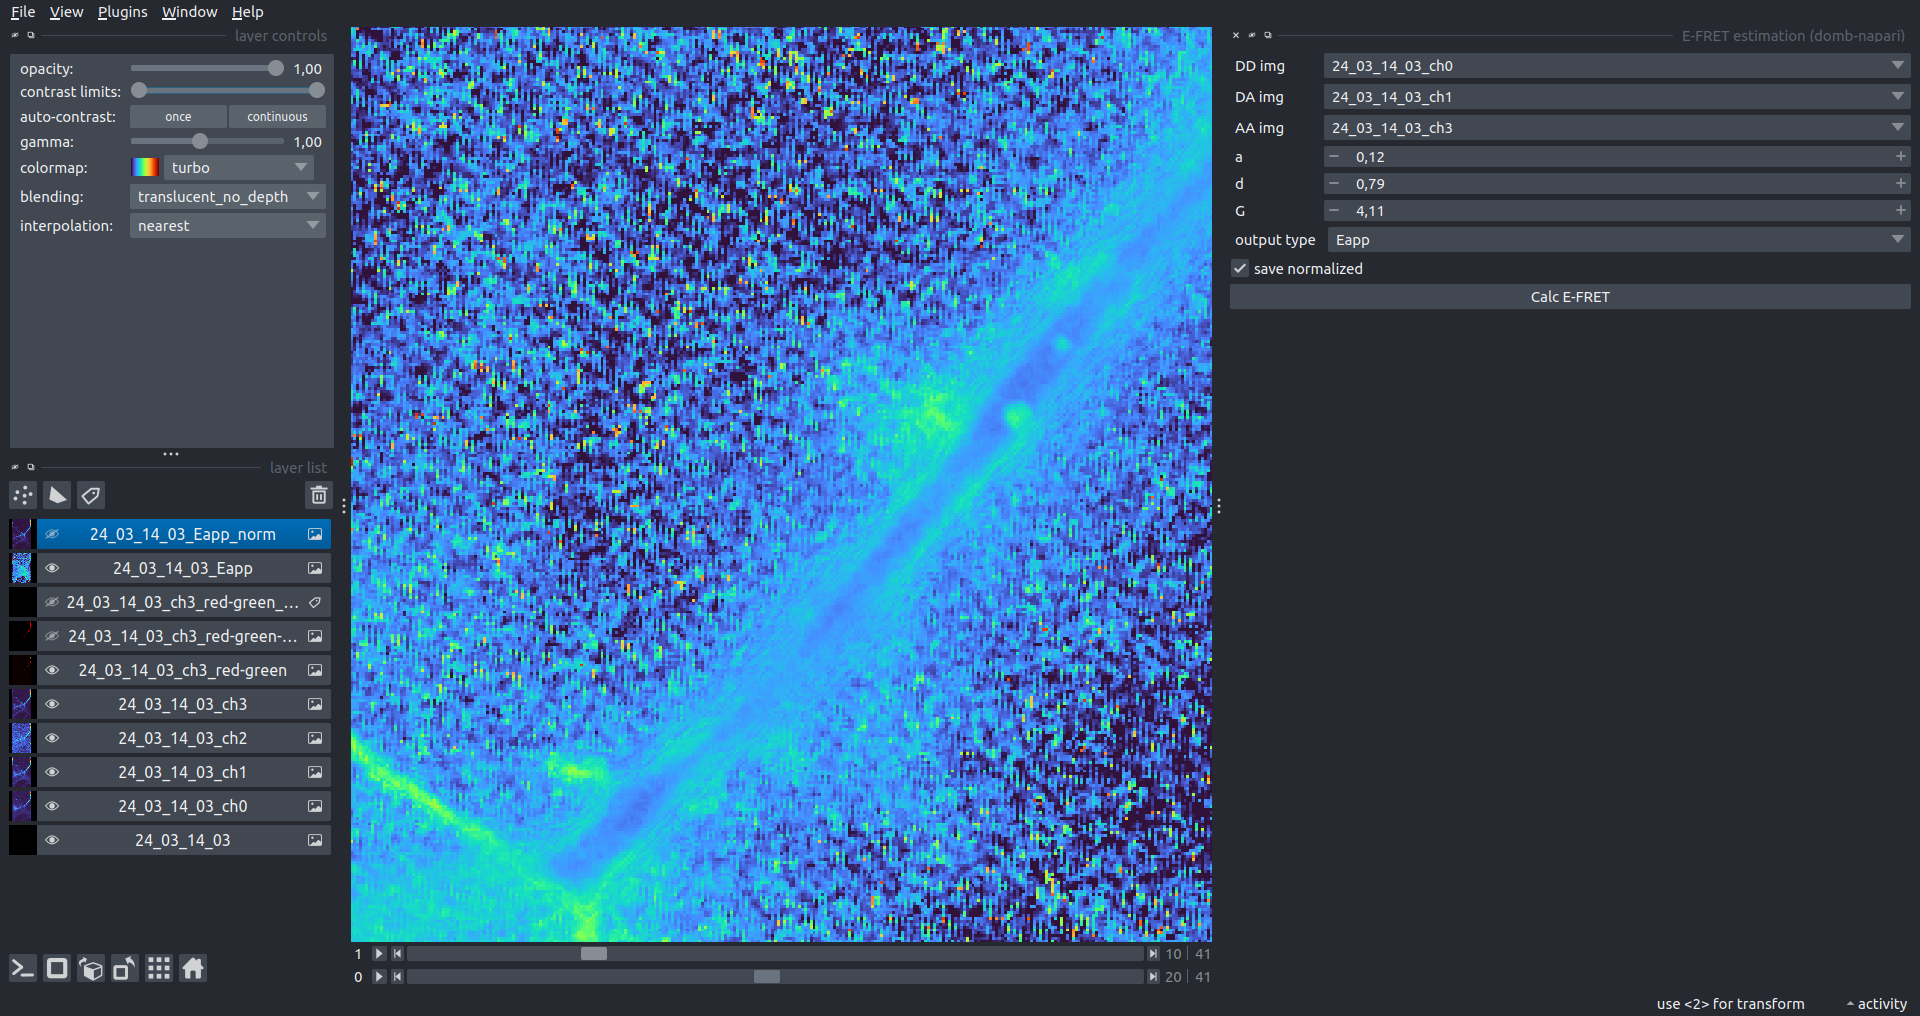\n:-:|:-:\n__Normalized Eapp__|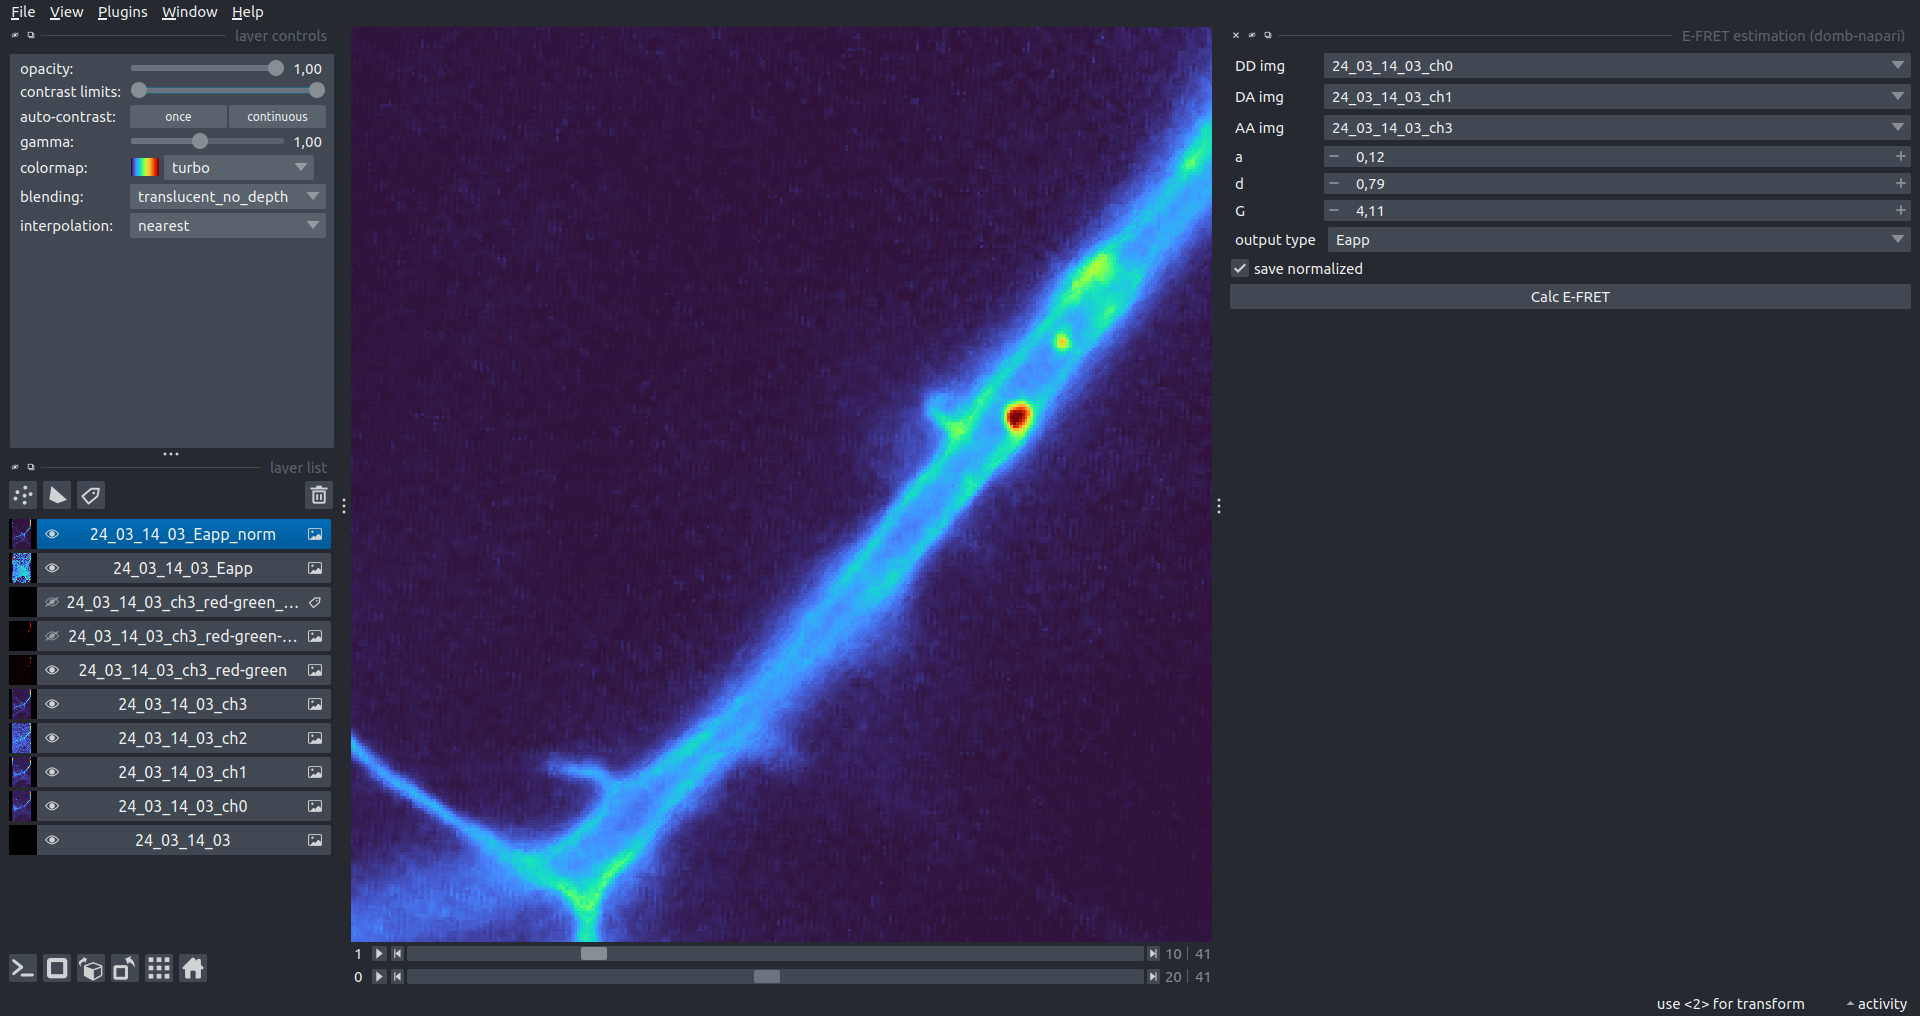\n\n\n---\n\n\n## Exo-/endo-cytosis monitoring with pH-sensitive tag\nA set of widgets designed for the analysis of image series containing the pH-sensitive fluorescence protein Superecliptic pHluorin (SEP).\n\nInsipred by [Fujii et al., 2017](https://pubmed.ncbi.nlm.nih.gov/28474392/) and [Sposini et al., 2020](https://www.nature.com/articles/s41596-020-0371-z).\n\n\n### SEP image preprocessing\nProcesses image series obtained through repetitive pH exchange methods (such as U-tube or ppH approaches). `pH 1st frame` option indicates the 1st frame pH. By default frames with odd indexes, including index 0, are interpreted as images acquired at pH 7.0, representing total fluorescence intensity (saved with the suffix `_total`). Even frames are interpreted as images obtained at acidic pH (5.5-6.0), representing intracellular fluorescence only (saved with the suffix `_intra`).\n\nIf `calc surface img` is selected, an additional total fluorescence image with subtracted intracellular intensity will be saved as the cell surface fluorescence fraction (suffix `_surface`). The input image should be a 3-dimensional single-channel time-lapse.\n\nThe `calc projections` option allows obtaining individual pH series projections (pixel-wise series MIP - pixel-wise series average) for the detection of individual exo/endocytosis events.\n\n\n---\n\n\n## Intensty profiles building and data frame saving\n### ROIs profiles\nThis widget builds a plot with mean intensity profiles for each Region of Interest (ROI) in labels. It uses either absolute intensity (if `absolute intensity` is selected) or relative intensities (\u0394F/F0).\n\n- `time scale` - sets the number of seconds between frames for x-axis scaling.\n- `\u0394F win` - the baseline intensity for \u0394F/F0 profiles is estimated as the mean intensity of the specified number of initial profile points.\n- `\u0394F amplitude lim` - allows filtering of ROIs by minimum and maximum \u0394F/F0 amplitudes. Note: Amplitude filtering works with \u0394F/F0 profiles only.\n- `profiles crop` - if selected, only a specified range of intensity profile indexes will be plotted, corresponding to the start and stop indexes from `profiles range`.\n\nAdditionally, you can save ROI intensity profiles as .csv files using the `save data frame` option and specifying the `saving path`. The output data frames named %img_name%_lab_prof.csv will include the following columns:\n\n- `id` - unique image ID, the name of the input `napari.Image` object.\n- `roi` - ROI number, consecutively numbered starting from 1.\n- `int` - ROI mean intensity, either raw or \u0394F/F0, according to the selected intensity option.\n- `dist` - average distance in px to the ROI from the frame, (if `save ROIs distances in data frame` option is selected).\n- `index` - frame index.\n- `time` - frame time point, adjusted according to the `time scale`.\n\n_Note: the data frame will contain information for all ROIs; amplitude filtering and crop options pertain to plotting only._\n\nAbsolute intensity | 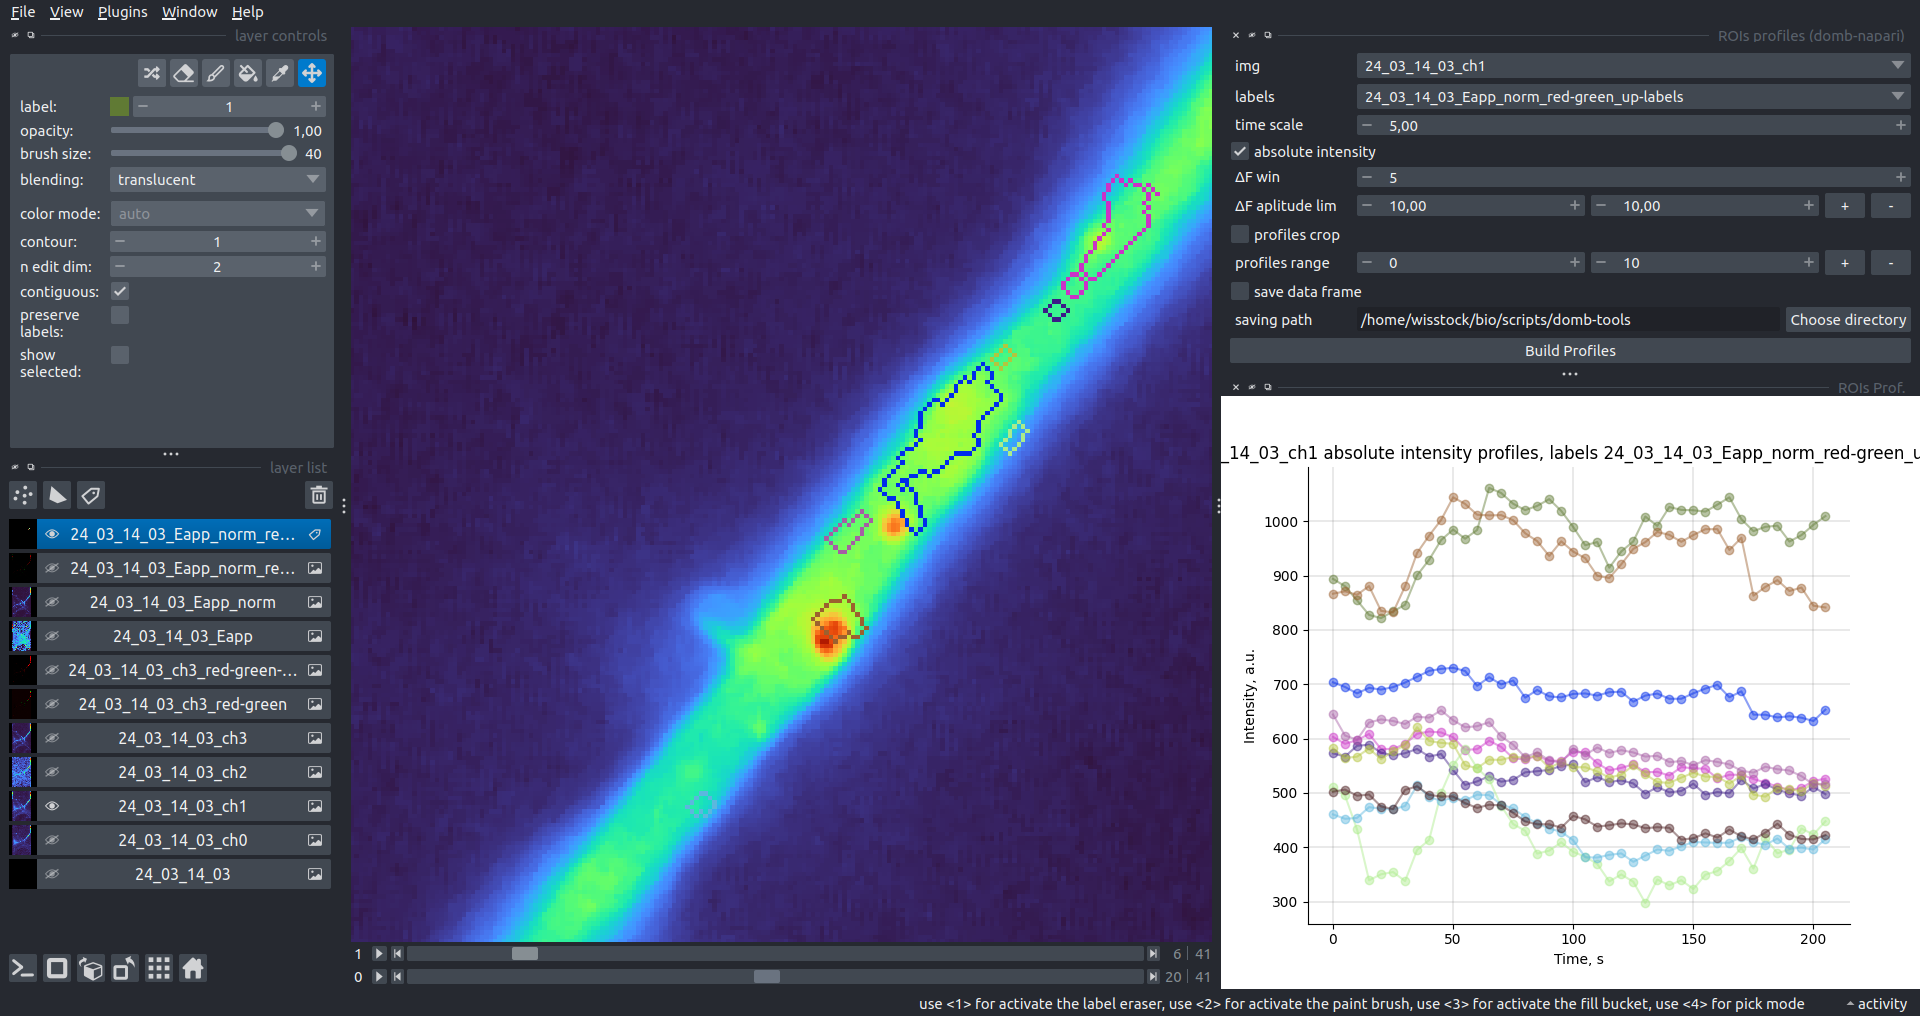\n:-------------------------:|:-------------------------:\n__\u0394F/F0__|\n\n\n### Multiple images stat profiles\nThis widget builds a plot displaying the averaged intensity of all Regions of Interest (ROI) specified in `lab`. It can handle up to three images (`img 0`, `img 1`, and `img 2`) as inputs, depending on the selected `profiles num`.\n\n`time scale`, `\u0394F win`, and `absolute intensity` parameters are identical as described in the __ROIs profiles__ widget.\n\nThe `stat method` allows for the estimation of intensity and associated errors through the following methods:\n- `se` - mean +/- standard error of the mean.\n- `iqr` - median +/- interquartile range.\n- `ci` - mean +/- 95% confidence interval based on the t-distribution.\n\nAbsolute intensity | 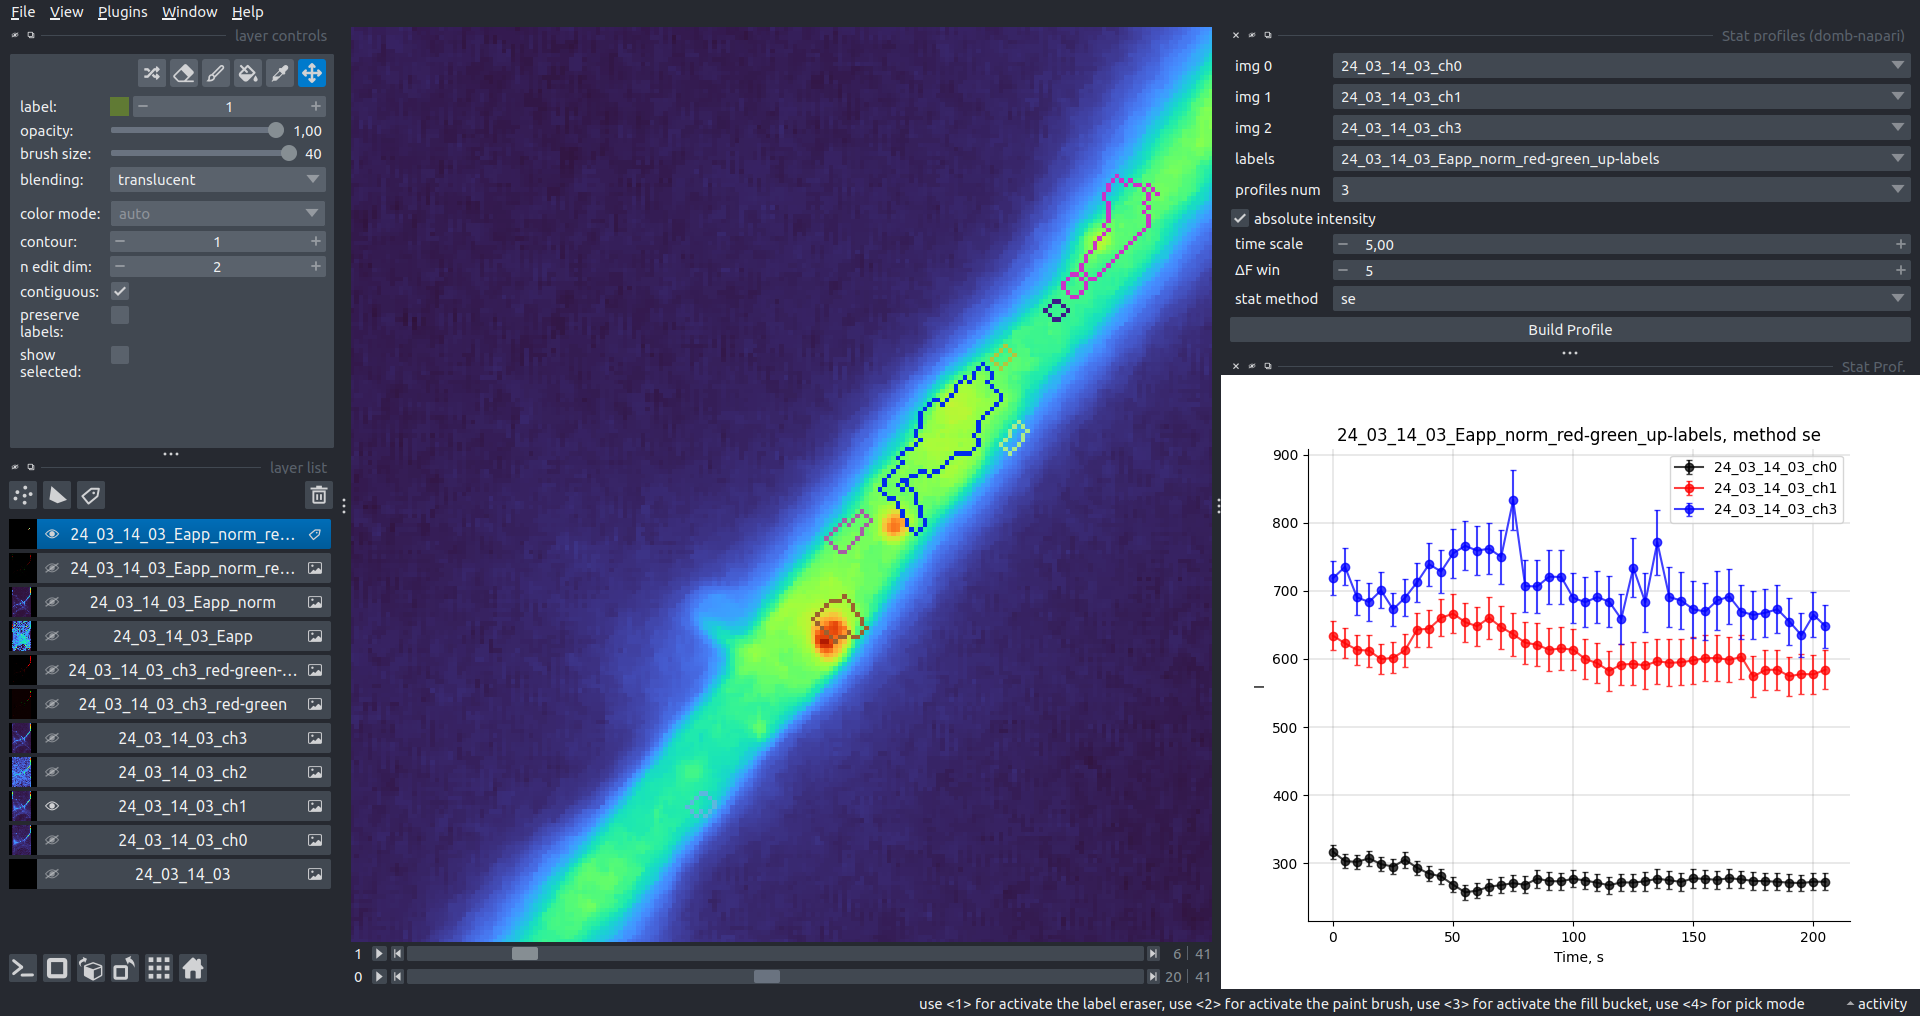\n:-------------------------:|:-------------------------:\n__\u0394F/F0__|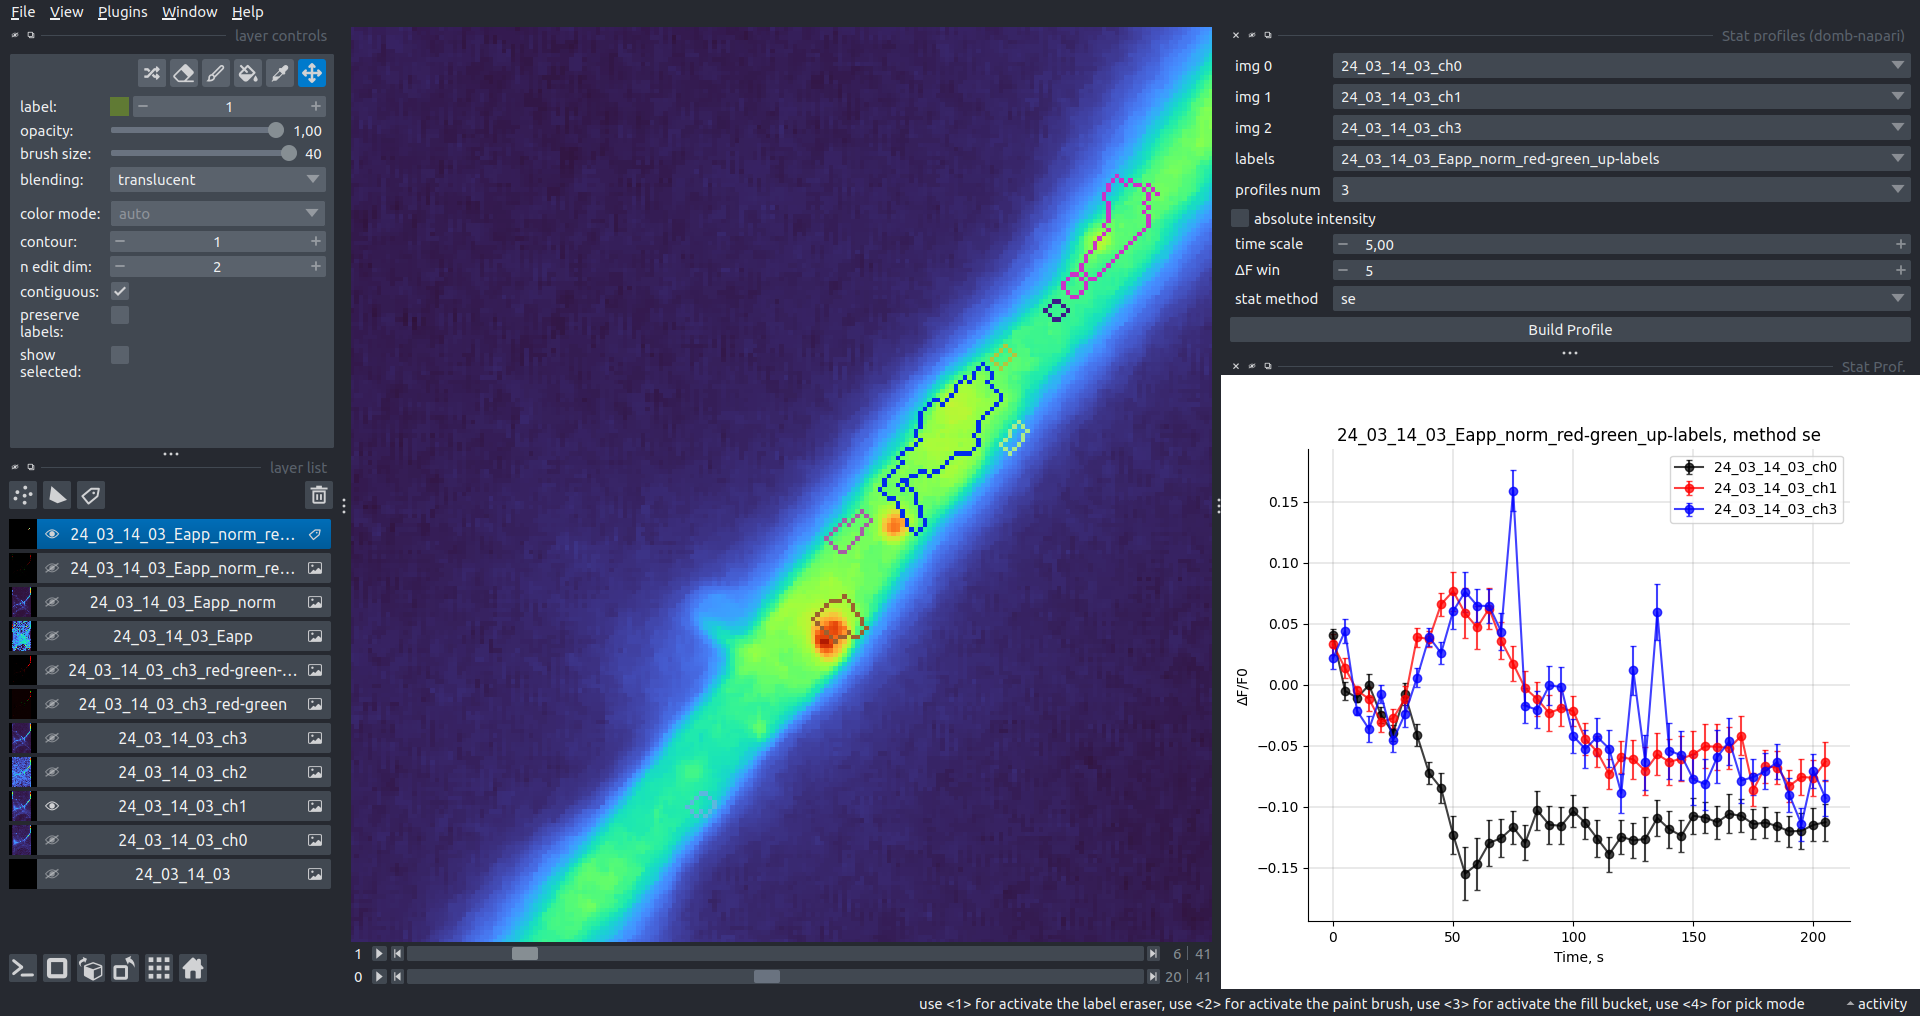\n\n\n### Multiple labels stat profiles\nThis widget builds a plot displaying the averaged intensity of all Regions of Interest (ROI) for one target `img`. It can handle up to three labels (`lab 0`, `lab 1`, and `lab 2`), depending on the selected `profiles num`.\n\n`time scale`, `\u0394F win`, and `absolute intensity` parameters are identical as described in the __ROIs profiles__ widget.\n\nThe `stat method` allows for the estimation of intensity and associated errors through the following methods:\n- `se` - mean +/- standard error of the mean.\n- `iqr` - median +/- interquartile range.\n- `ci` - mean +/- 95% confidence interval based on the t-distribution.\n\nAbsolute intensity | 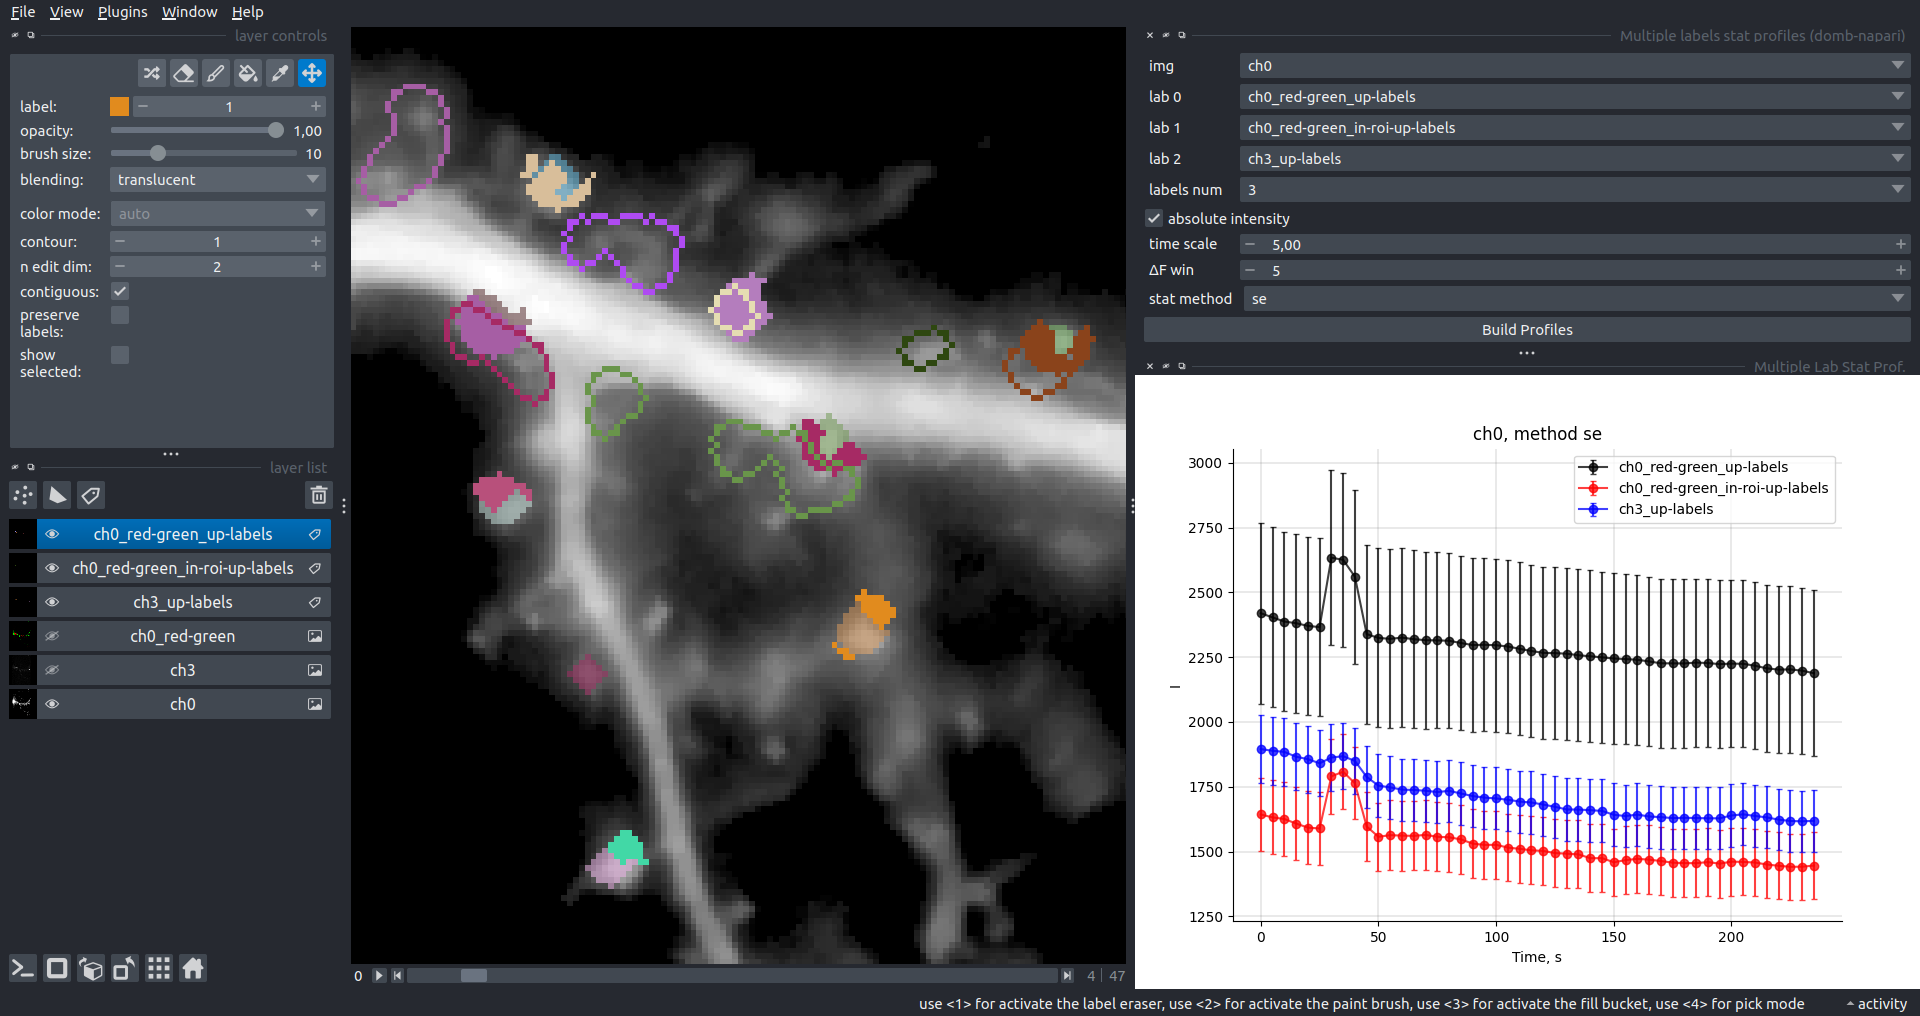\n:-------------------------:|:-------------------------:\n__\u0394F/F0__|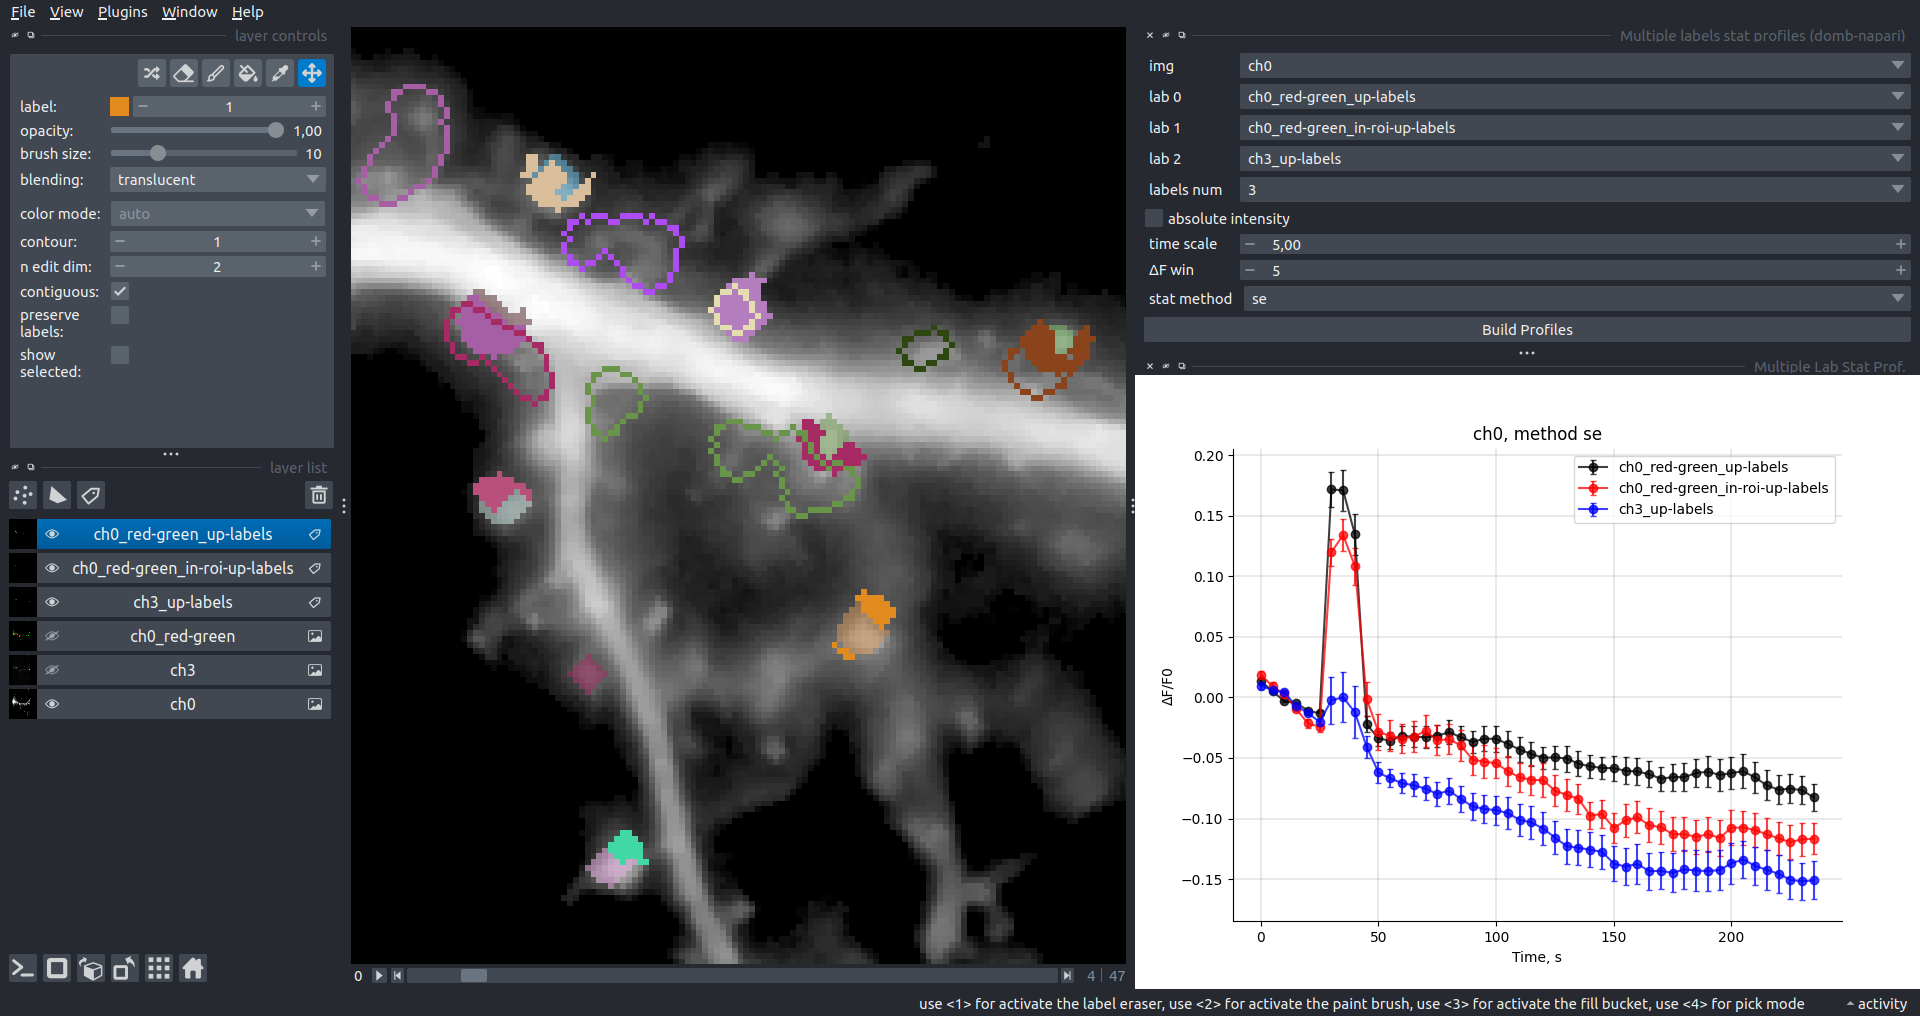\n",
"description_content_type": "text/markdown",
"keywords": null,
"home_page": null,
"download_url": null,
"author": "Borys Olifirov",
"author_email": "omnia.fatum@gmail.com",
"maintainer": null,
"maintainer_email": null,
"license": "MIT",
"classifier": [
"Framework :: napari",
"Development Status :: 3 - Alpha",
"License :: OSI Approved :: MIT License",
"Programming Language :: Python :: 3.8",
"Programming Language :: Python :: 3.9",
"Programming Language :: Python :: 3.10",
"Programming Language :: Python :: 3.11",
"Operating System :: OS Independent",
"Topic :: Scientific/Engineering :: Bio-Informatics",
"Topic :: Scientific/Engineering :: Image Processing",
"Topic :: Scientific/Engineering :: Image Recognition",
"Topic :: Utilities"
],
"requires_dist": [
"napari",
"domb",
"dipy"
],
"requires_python": ">=3.8",
"requires_external": null,
"project_url": [
"Documentation, https://domb.bio/",
"Source Code, https://github.com/wisstock/domb-napari",
"Bug Tracker, https://github.com/wisstock/domb-napari/issues",
"User Support, https://github.com/wisstock/domb-napari/issues"
],
"provides_extra": null,
"provides_dist": null,
"obsoletes_dist": null
},
"npe1_shim": false
}