Skip to content
This repository has been archived by the owner on Nov 28, 2020. It is now read-only.

Perf/Node.js #168

Closed
mhdawson opened this issue Nov 3, 2017 · 15 comments
Closed

Perf/Node.js #168

mhdawson opened this issue Nov 3, 2017 · 15 comments

Comments

@mhdawson
Copy link
Member

mhdawson commented Nov 3, 2017

@bmeurer you mentioned something in passing in the last meeting about the change in pipeline affecting the results from perf (I think).

Given that the diagnostics WG is documenting nodejs/nodejs.org#1444 I think it confirms there is interest and I wanted to follow up to see if what you had mentioned would affect this workflow.

@mhdawson
Copy link
Member Author

mhdawson commented Nov 3, 2017

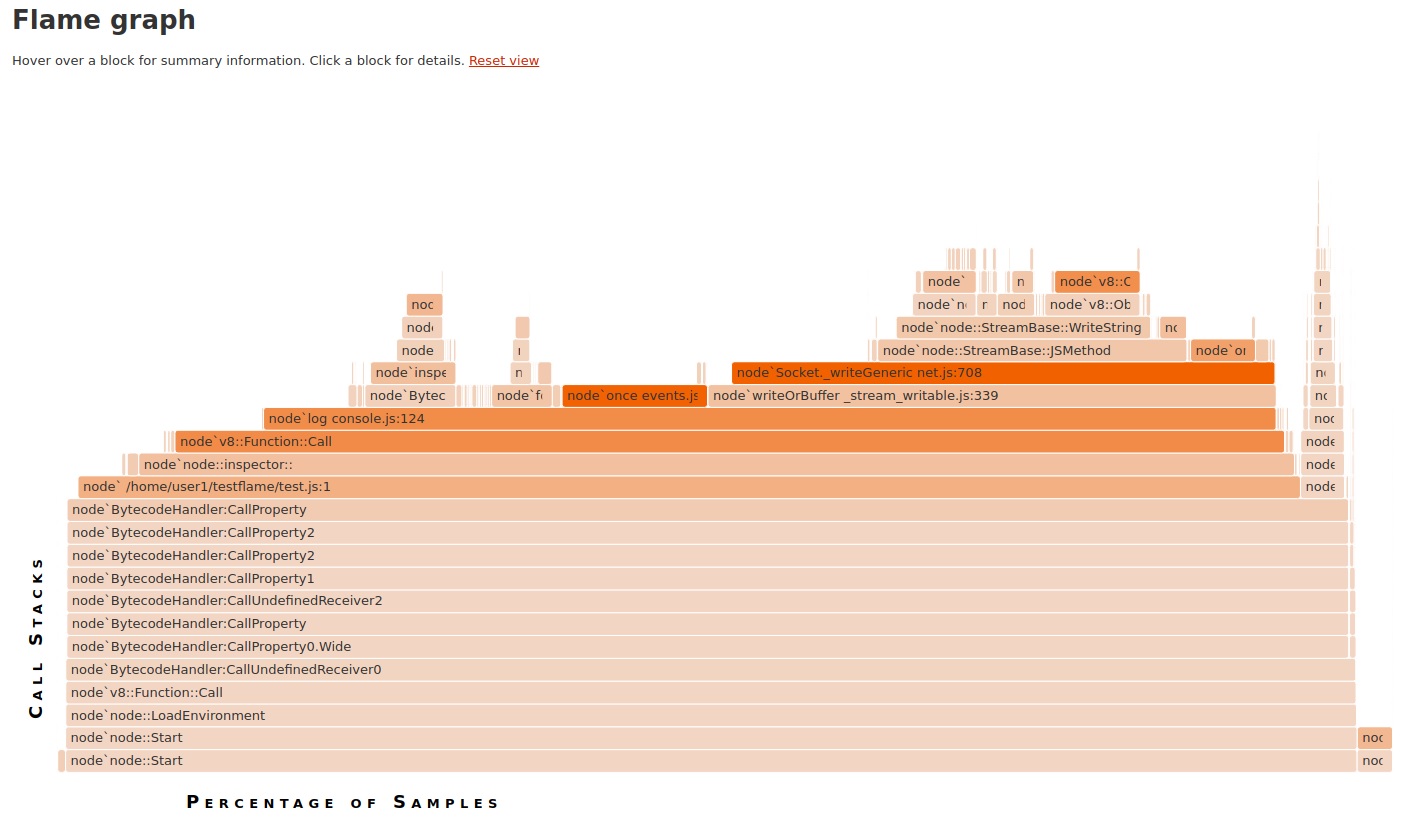
I went through the guide to generate a flamegraph and I see a lot of "ByteCodeHandler:xxxx"

@bmeurer
Copy link
Member

bmeurer commented Nov 3, 2017

Yes, perf doesn't know about bytecode handlers, so it's broken wrt. the interpreter. Some additional (post)processing is required. We can chat in Ireland.

@mhdawson
Copy link
Member Author

mhdawson commented Nov 3, 2017

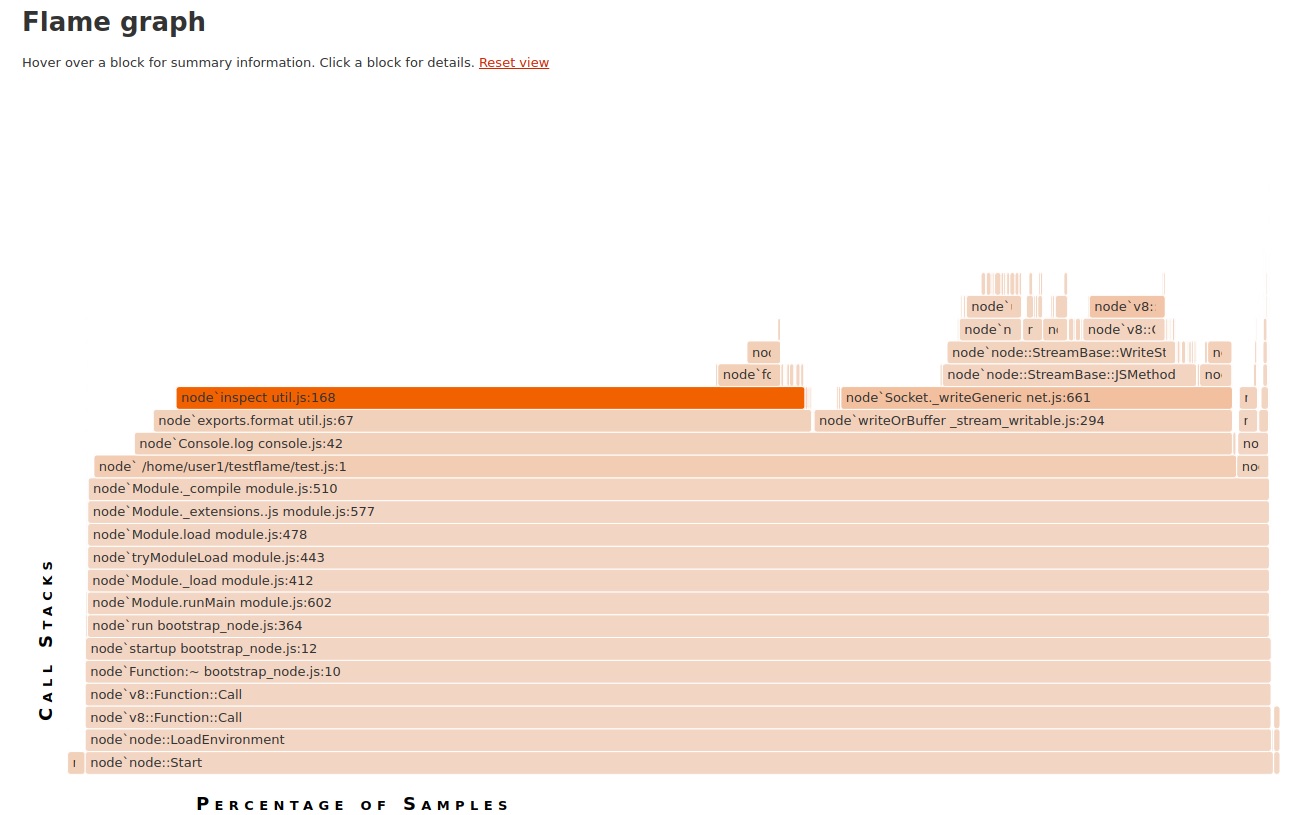
Yup just confirmed running 6.x versus 8.x with 8.x being the first one and 6.x the second.

v8-flame
v6-flame

@mhdawson
Copy link
Member Author

mhdawson commented Nov 3, 2017

@nodejs/diagnostics as an FYI

@AndreasMadsen
Copy link
Member

Thanks. I'm very interested in solutions to this. I know it is a problem in 0x too /cc @mcollina

@mcollina
Copy link
Member

mcollina commented Nov 3, 2017

I can confirm as well. From my in-the-wild experimentation, generating those diagram is still useful: they point at a likely bottleneck of your application. Most hot code gets optimimized by turbofan under load, so it is not a blocker. However if you plan to diagnose the boot sequence then it is is.

@mhdawson
Copy link
Member Author

mhdawson commented Nov 7, 2017

talking with @bmeurer he also pointed out that code can be de-optimized as well and in that case even if it is under load this can be a problem.

@hashseed
Copy link
Member

hashseed commented Dec 1, 2017

Just to recap for those who do not have the full context:

Previously, V8 would always run native JIT code. Linux perf or similar tools would periodically walk the stack and collect PCs from every frame. Those PCs can be attributed to individual code objects, each corresponding to one or more (in case of inlining) functions in the source code.

With the bytecode interpreter (Ignition), this is no longer possible. The bytecode interpreter executes on bytecode handlers, code snippets that correspond to each bytecode. By walking the stack, interpreted frames would only show PCs inside those handlers, which do not correspond to any particular function.

There are some ideas to fix this:

  • Teach Linux perf and similar tools to walk V8's stack. With --prof, V8's internal profiler, walking the stack to collect useful information from interpreted frames already works. For interpreted frames, we would collect pointers into the bytecode instead of PCs into native code. The pointer to the bytecode array and the offset into it are stored on the interpreted frame and can be easily extracted. However, it's unclear to me how difficult it is to change the stack walker in Linux perf.
  • Each interpreted frame actually consist of two real frames. One of which is the InterpreterEntryTrampoline, and the second one is a frame constructed for the bytecode handlers. It would be thinkable to not leave the PC of the InterpreterEntryTrampoline on the stack, but instead that of a code snippet that tail calls back into the InterpreterEntryTrampoline. By having such a code snippet for every function, we could match profile ticks to the function. However, Linux perf still need to be taught how to skip frames, and we would not have detailed info where inside the function we collected the same from.
  • Change --prof to also collect native frames and somehow reduce the distortion to runtime to meet the requirements that made perf and other tools necessary in the first place.

@fhinkel
@jaro-sevcik please fact-check :)

@bmeurer
Copy link
Member

bmeurer commented Dec 4, 2017

@hashseed Good summary. Fact-check passed 👍

There are also additional complications with moving bytecode array code objects, that you need to get right with perf. In general, I don't think changing perfs stack walker is doable, especially since we'd need the same for dtrace soon.

Maybe we can really beef up --prof to meet the requirements of Node?

@bmeurer
Copy link
Member

bmeurer commented Dec 4, 2017

Upstream bug: v8:7155

@mmarchini
Copy link

However, it's unclear to me how difficult it is to change the stack walker in Linux perf

It's not easy. I tried this approach with eBPF profile tool (which is similar to Linux perf), but I couldn't make it work. Besides being hard, this approach also has the downside that it needs to be reimplemented to all interested tools (Linux perf, eBPF profiler, dtrace, etc.).

I didn't explore the second approach yet, but it seems promising. In theory, it would work for any external tool which worked before Ignition (without changing those external tools). If the V8 team would be ok with this approach, I can give it a try. Otherwise, I'll work on the third approach.

However, Linux perf still need to be taught how to skip frames

I don't think that's an issue because we can remove those frames after we collect them (post-processing the output from Linux perf, for example)

we would not have detailed info where inside the function we collected the same from

I'm not sure I understood this part. Could you please elaborate?

@hashseed
Copy link
Member

hashseed commented Feb 6, 2018

we would not have detailed info where inside the function we collected the same from

I'm not sure I understood this part. Could you please elaborate?

With the second approach, you can find out which function is on the stack, but not where inside the function you collected the sample from. I.e. you can't figure out which source line exactly the tick comes from.

/cc @fhinkel

Also, thanks a lot for experimenting with the options!

@mmarchini
Copy link

@hashseed thanks, now I understood :)

I think Linux perf wasn't able to tell the exact line before Ignition either, just where the function was declared. I'll confirm that though

@mmarchini
Copy link

mmarchini commented Feb 21, 2018

This is being covered in nodejs/diagnostics#148. I suggest closing this issue here.

@mhdawson
Copy link
Member Author

mhdawson commented Mar 7, 2018

Closing as covered by nodejs/diagnostics#148

@mhdawson mhdawson closed this as completed Mar 7, 2018
Sign up for free to subscribe to this conversation on GitHub. Already have an account? Sign in.
Projects
None yet
Development

No branches or pull requests

6 participants