- Introduction
- Participation
- Challenges
- Submission rules
- Results format
- Classes and attributes
- Evaluation metrics
- Leaderboard
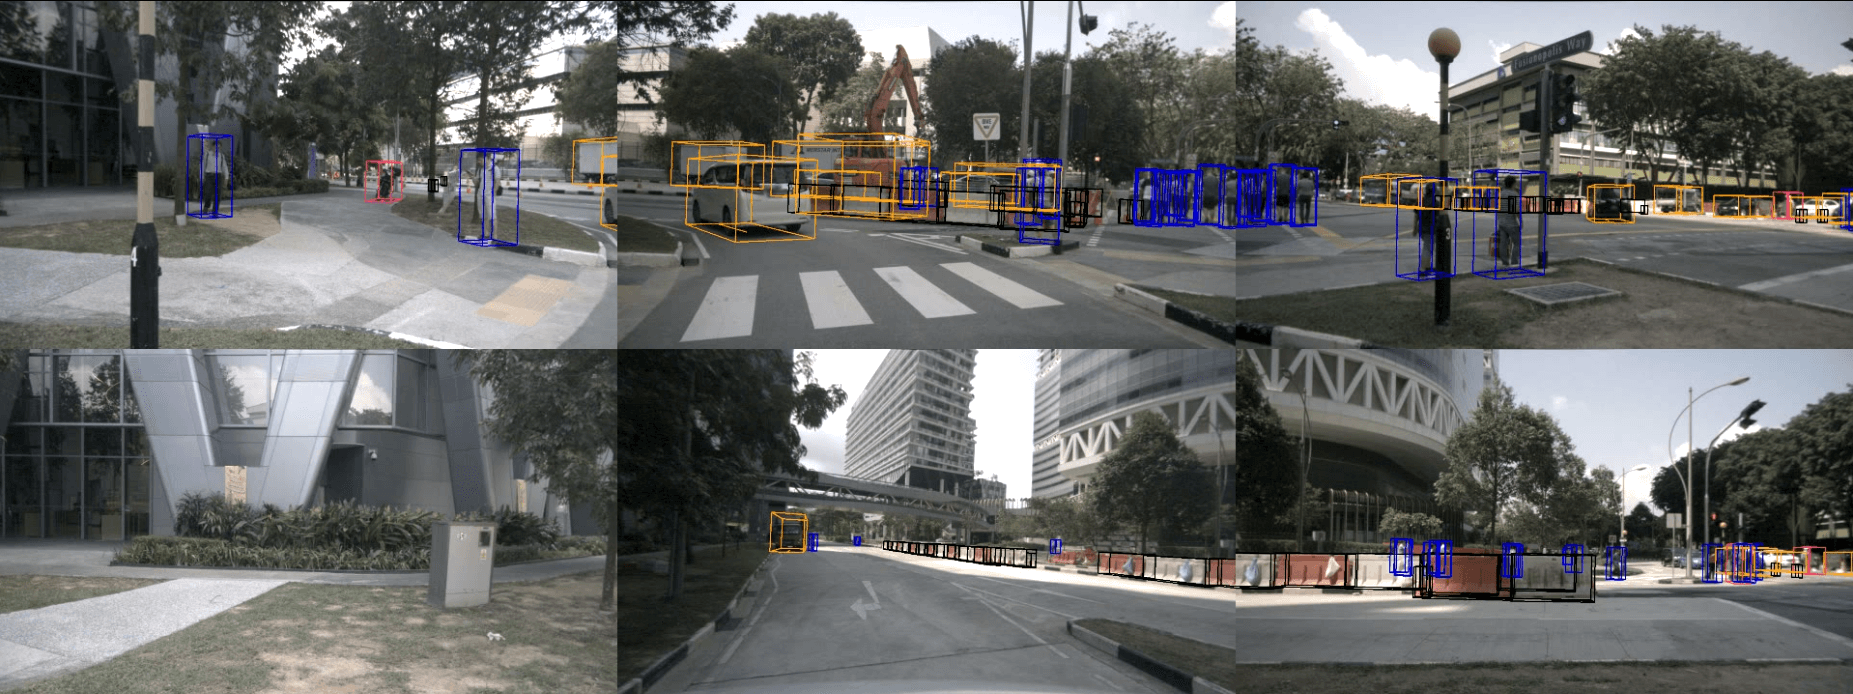
Here we define the 3D object detection task on nuScenes. The goal of this task is to place a 3D bounding box around 10 different object categories, as well as estimating a set of attributes and the current velocity vector.
The nuScenes detection evaluation server is open all year round for submission. To participate in the challenge, please create an account at EvalAI. Then upload your zipped result file including all of the required meta data. After each challenge, the results will be exported to the nuScenes leaderboard shown above. This is the only way to benchmark your method against the test dataset. We require that all participants send the following information to nuScenes@motional.com after submitting their results on EvalAI:
- Team name
- Method name
- Authors
- Affiliations
- Method description (5+ sentences)
- Project URL
- Paper URL
- FPS in Hz (and the hardware used to measure it)
To allow users to benchmark the performance of their method against the community, we host a single leaderboard all-year round. Additionally we organize a number of challenges at leading Computer Vision conference workshops. Users that submit their results during the challenge period are eligible for awards. Any user that cannot attend the workshop (direct or via a representative) will be excluded from the challenge, but will still be listed on the leaderboard.
Click here for the EvalAI detection evaluation server.
The fourth nuScenes detection challenge will be held at ICRA 2021 as part of The AI Driving Olympics: Evaluating Progress in Robotics through Standardized and Reproducible Benchmarks. Submissions will be accepted from April 1 to May 26, 2021. The prizes will be awarded to submissions that outperform the previous state-of-the-art in their respective tracks. Results and winners will be announced at The AI Driving Olympics: Evaluating Progress in Robotics through Standardized and Reproducible Benchmarks. Note that this challenge uses the same evaluation server as previous detection challenges.
A summary of the results can be seen below. For details, please refer to the detection leaderboard.
| Rank | Team name | NDS | Award |
|---|---|---|---|
| 1 | CenterPoint-Fusion and FusionPainting | 74.9% | Best submission |
| 2 | PointAugmenting V2 | 70.9% | - |
| 3 | Multimodal Virtual Point | 70.5% | Most innovative |
The third nuScenes detection challenge will be held at NeurIPS 2020. Submissions will be accepted from November 1 to December 8, 2020. Results and winners will be announced at the 5th AI Driving Olympics at NeurIPS 2020. Note that this challenge uses the same evaluation server as previous detection challenges.
A summary of the results can be seen below. For details, please refer to the detection leaderboard.
| Rank | Team name | NDS | Award |
|---|---|---|---|
| 1 | CenterPoint | 71.4% | Best submission |
| 2 | PointAugmenting | 71.1% | Second best |
| 3 | MoCa | 70.9% | Best PKL |
| 4 | PVC ensemble | 70.4% | Best lidar-only submission |
The second nuScenes detection challenge will be held at ICRA 2020. The submission period will open April 1 and continue until May 28th, 2020. Results and winners will be announced at the Workshop on Benchmarking Progress in Autonomous Driving. Note that the previous evaluation server can still be used to benchmark your results after the challenge period.
A summary of the results can be seen below. For details, please refer to the detection leaderboard.
| Rank | Team name | NDS | Award |
|---|---|---|---|
| 1 | Noah CV Lab fusion | 69.0% | Best submission |
| 2 | CenterPoint | 67.5% | Best student submission |
| 3 | CVCNet ensemble | 66.6% | Honorable mention |
| 4 | PanoNet3D | 63.1% | - |
| 5 | CRIPAC | 63.2% | - |
| 6 | SSN | 61.6% | - |
The first nuScenes detection challenge was held at CVPR 2019. Submission opened May 6 and closed June 12, 2019. Results and winners were announced at the Workshop on Autonomous Driving (WAD) at CVPR 2019. For more information see the leaderboard. Note that the evaluation server can still be used to benchmark your results.
A summary of the results can be seen below. For details, please refer to the detection leaderboard.
| Rank | Team name | NDS | Award |
|---|---|---|---|
| 1 | MEGVII G3D3 | 63.3% | Best submission |
| 2 | Tolist | 54.5% | Best student submission |
| 3 | SARPNET AT3D | 48.4% | - |
| 4 | MAIR | 38.4% | Best vision-only submission |
| 5 | VIPL | 35.3% | - |
- The maximum time window of past sensor data and ego poses that may be used at inference time is approximately 0.5s (at most 6 past camera images, 6 past radar sweeps and 10 past lidar sweeps). At training time there are no restrictions.
- We release annotations for the train and val set, but not for the test set.
- We release sensor data for train, val and test set.
- Users make predictions on the test set and submit the results to our evaluation server, which returns the metrics listed below.
- We do not use strata. Instead, we filter annotations and predictions beyond class specific distances.
- Users must limit the number of submitted boxes per sample to 500.
- Every submission provides method information. We encourage publishing code, but do not make it a requirement.
- Top leaderboard entries and their papers will be manually reviewed.
- Each user or team can have at most one account per year on the evaluation server. Users that create multiple accounts to circumvent the rules will be excluded from the competition.
- Each user or team can submit at most three results per year. These results must come from different models, rather than submitting results from the same model at different training epochs or with slightly different parameters.
- Faulty submissions that return an error on Eval AI do not count towards the submission limit.
- Any attempt to circumvent these rules will result in a permanent ban of the team or company from all nuScenes challenges.
We define a standardized detection result format that serves as an input to the evaluation code.
Results are evaluated for each 2Hz keyframe, also known as sample.
The detection results for a particular evaluation set (train/val/test) are stored in a single JSON file.
For the train and val sets the evaluation can be performed by the user on their local machine.
For the test set the user needs to zip the single JSON result file and submit it to the official evaluation server.
The JSON file includes meta data meta on the type of inputs used for this method.
Furthermore it includes a dictionary results that maps each sample_token to a list of sample_result entries.
Each sample_token from the current evaluation set must be included in results, although the list of predictions may be empty if no object is detected.
submission {
    "meta": {
        "use_camera":   <bool>          -- Whether this submission uses camera data as an input.
        "use_lidar":    <bool>          -- Whether this submission uses lidar data as an input.
        "use_radar":    <bool>          -- Whether this submission uses radar data as an input.
        "use_map":      <bool>          -- Whether this submission uses map data as an input.
        "use_external": <bool>          -- Whether this submission uses external data as an input.
    },
    "results": {
        sample_token <str>: List[sample_result] -- Maps each sample_token to a list of sample_results.
    }
}
For the predictions we create a new database table called sample_result.
The sample_result table is designed to mirror the sample_annotation table.
This allows for processing of results and annotations using the same tools.
A sample_result is a dictionary defined as follows:
sample_result {
    "sample_token":       <str>         -- Foreign key. Identifies the sample/keyframe for which objects are detected.
    "translation":        <float> [3]   -- Estimated bounding box location in m in the global frame: center_x, center_y, center_z.
    "size":               <float> [3]   -- Estimated bounding box size in m: width, length, height.
    "rotation":           <float> [4]   -- Estimated bounding box orientation as quaternion in the global frame: w, x, y, z.
    "velocity":           <float> [2]   -- Estimated bounding box velocity in m/s in the global frame: vx, vy.
    "detection_name":     <str>         -- The predicted class for this sample_result, e.g. car, pedestrian.
    "detection_score":    <float>       -- Object prediction score between 0 and 1 for the class identified by detection_name.
    "attribute_name":     <str>         -- Name of the predicted attribute or empty string for classes without attributes.
                                           See table below for valid attributes for each class, e.g. cycle.with_rider.
                                           Attributes are ignored for classes without attributes.
                                           There are a few cases (0.4%) where attributes are missing also for classes
                                           that should have them. We ignore the predicted attributes for these cases.
}
Note that the detection classes may differ from the general nuScenes classes, as detailed below.
The nuScenes dataset comes with annotations for 23 classes (details). Some of these only have a handful of samples. Hence we merge similar classes and remove rare classes. This results in 10 classes for the detection challenge. Below we show the table of detection classes and their counterparts in the nuScenes dataset. For more information on the classes and their frequencies, see this page.
| nuScenes detection class | nuScenes general class |
|---|---|
| void / ignore | animal |
| void / ignore | human.pedestrian.personal_mobility |
| void / ignore | human.pedestrian.stroller |
| void / ignore | human.pedestrian.wheelchair |
| void / ignore | movable_object.debris |
| void / ignore | movable_object.pushable_pullable |
| void / ignore | static_object.bicycle_rack |
| void / ignore | vehicle.emergency.ambulance |
| void / ignore | vehicle.emergency.police |
| barrier | movable_object.barrier |
| bicycle | vehicle.bicycle |
| bus | vehicle.bus.bendy |
| bus | vehicle.bus.rigid |
| car | vehicle.car |
| construction_vehicle | vehicle.construction |
| motorcycle | vehicle.motorcycle |
| pedestrian | human.pedestrian.adult |
| pedestrian | human.pedestrian.child |
| pedestrian | human.pedestrian.construction_worker |
| pedestrian | human.pedestrian.police_officer |
| traffic_cone | movable_object.trafficcone |
| trailer | vehicle.trailer |
| truck | vehicle.truck |
Below we list which nuScenes classes can have which attributes. Note that some annotations are missing attributes (0.4% of all sample_annotations).
For each nuScenes detection class, the number of annotations decreases with increasing range from the ego vehicle, but the number of annotations per range varies by class. Therefore, each class has its own upper bound on evaluated detection range, as shown below:
| nuScenes detection class | Attributes | Detection range (meters) |
|---|---|---|
| barrier | void | 30 |
| traffic_cone | void | 30 |
| bicycle | cycle.{with_rider, without_rider} | 40 |
| motorcycle | cycle.{with_rider, without_rider} | 40 |
| pedestrian | pedestrian.{moving, standing, sitting_lying_down} | 40 |
| car | vehicle.{moving, parked, stopped} | 50 |
| bus | vehicle.{moving, parked, stopped} | 50 |
| construction_vehicle | vehicle.{moving, parked, stopped} | 50 |
| trailer | vehicle.{moving, parked, stopped} | 50 |
| truck | vehicle.{moving, parked, stopped} | 50 |
Below we define the metrics for the nuScenes detection task. Our final score is a weighted sum of mean Average Precision (mAP) and several True Positive (TP) metrics.
Before running the evaluation code the following pre-processing is done on the data
- All boxes (GT and prediction) are removed if they exceed the class-specific detection range.
- All bikes and motorcycle boxes (GT and prediction) that fall inside a bike-rack are removed. The reason is that we do not annotate bikes inside bike-racks.
- All boxes (GT) without lidar or radar points in them are removed. The reason is that we can not guarantee that they are actually visible in the frame. We do not filter the predicted boxes based on number of points.
- mean Average Precision (mAP): We use the well-known Average Precision metric, but define a match by considering the 2D center distance on the ground plane rather than intersection over union based affinities. Specifically, we match predictions with the ground truth objects that have the smallest center-distance up to a certain threshold. For a given match threshold we calculate average precision (AP) by integrating the recall vs precision curve for recalls and precisions > 0.1. We finally average over match thresholds of {0.5, 1, 2, 4} meters and compute the mean across classes.
Here we define metrics for a set of true positives (TP) that measure translation / scale / orientation / velocity and attribute errors. All TP metrics are calculated using a threshold of 2m center distance during matching, and they are all designed to be positive scalars.
Matching and scoring happen independently per class and each metric is the average of the cumulative mean at each achieved recall level above 10%. If 10% recall is not achieved for a particular class, all TP errors for that class are set to 1. We define the following TP errors:
- Average Translation Error (ATE): Euclidean center distance in 2D in meters.
- Average Scale Error (ASE): Calculated as 1 - IOU after aligning centers and orientation.
- Average Orientation Error (AOE): Smallest yaw angle difference between prediction and ground-truth in radians. Orientation error is evaluated at 360 degree for all classes except barriers where it is only evaluated at 180 degrees. Orientation errors for cones are ignored.
- Average Velocity Error (AVE): Absolute velocity error in m/s. Velocity error for barriers and cones are ignored.
- Average Attribute Error (AAE): Calculated as 1 - acc, where acc is the attribute classification accuracy. Attribute error for barriers and cones are ignored.
All errors are >= 0, but note that for translation and velocity errors the errors are unbounded, and can be any positive value.
The TP metrics are defined per class, and we then take a mean over classes to calculate mATE, mASE, mAOE, mAVE and mAAE.
- nuScenes detection score (NDS): We consolidate the above metrics by computing a weighted sum: mAP, mATE, mASE, mAOE, mAVE and mAAE. As a first step we convert the TP errors to TP scores as TP_score = max(1 - TP_error, 0.0). We then assign a weight of 5 to mAP and 1 to each of the 5 TP scores and calculate the normalized sum.
The default evaluation metrics configurations can be found in nuscenes/eval/detection/configs/detection_cvpr_2019.json.
nuScenes will maintain a single leaderboard for the detection task. For each submission the leaderboard will list method aspects and evaluation metrics. Method aspects include input modalities (lidar, radar, vision), use of map data and use of external data. To enable a fair comparison between methods, the user will be able to filter the methods by method aspects.
We define three such filters here which correspond to the tracks in the nuScenes detection challenge. Methods will be compared within these tracks and the winners will be decided for each track separately. Furthermore, there will also be an award for novel ideas, as well as the best student submission.
Lidar track:
- Only lidar input allowed.
- External data or map data not allowed.
- May use pre-training.
Vision track:
- Only camera input allowed.
- External data or map data not allowed.
- May use pre-training.
Open track:
- Any sensor input allowed.
- External data and map data allowed.
- May use pre-training.
Details:
-
Sensor input: For the lidar and vision tracks we restrict the type of sensor input that may be used. Note that this restriction applies only at test time. At training time any sensor input may be used. In particular this also means that at training time you are allowed to filter the GT boxes using
num_lidar_ptsandnum_radar_pts, regardless of the track. However, during testing the predicted boxes may not be filtered based on input from other sensor modalities. -
Map data: By
map datawe mean using the semantic map provided in nuScenes. -
Meta data: Other meta data included in the dataset may be used without restrictions. E.g. calibration parameters, ego poses,
location,timestamp,num_lidar_pts,num_radar_pts,translation,rotationandsize. Note thatinstance,sample_annotationandscenedescription are not provided for the test set. -
Pre-training: By pre-training we mean training a network for the task of image classification using only image-level labels, as done in [Krizhevsky NIPS 2012]. The pre-training may not involve bounding box, mask or other localized annotations.
-
Reporting: Users are required to report detailed information on their method regarding sensor input, map data, meta data and pre-training. Users that fail to adequately report this information may be excluded from the challenge.