Observe Entity Explorer allows discovery of dependencies between Observe objects (datasets, worksheets, dashboards, monitors, stages, parameters).

NOTE: This tool uses the Observe GraphQL API, which is not [yet] a publicly documented API. Therefore this tool, or any application that you develop that is derived from it may stop working without notice in the future. If you have specific API needs that are not covered by our currently documented API found at https://developer.observeinc.com/, please contact us for more information.
Observe Entity Explorer can run on Windows, Mac or Linux. Binaries are in Releases.
-
Install .NET 8.0 SDK
- Download Microsoft Downloads web site with all instructions, or:
- Direct x64 installer
- Direct arm64 (M1/M2) installer
- OR
- Homebrew brew install dotnet
- Download Microsoft Downloads web site with all instructions, or:
-
Download Releases\
observe-entity-explorer.osx-x64.<version>.zipfor Intel orobserve-entity-explorer.osx-arm64.<version>.zipfor M1/M2 machines, but do not extract the archive yet. -
Remove the quarantine attribute that will otherwise stop the application from running this command in your terminal:
xattr -d com.apple.quarantine observe-entity-explorer.osx*.zip -
Extract the archive:
unzip observe-entity-explorer.osx*.zip -
Run the application from the extracted folder:
dotnet ./observe-entity-explorer.dll
-
Download Releases\
observe-entity-explorer.win-x64.<version>.zip -
Extract the archive using File Explorer or:
Expand-Archive observe-entity-explorer.win*.zip
-
Run the application from the extracted folder:
.\observe-entity-explorer.exe
-
Download Releases\
observe-entity-explorer.linux-x64.<version>.zip -
Extract the archive:
unzip observe-entity-explorer.linux*.zip -
Run the application from the extracted folder:
./observe-entity-explorer
You can also run it from source.
First, install .NET 8.0 SDK from Microsoft Downloads web site.
Then clone, build and run:
# Clone repo to local folder
git clone https://github.com/observeinc/entity-explorer entity-explorer

# Change to local folder
cd entity-explorer

# For Win and Linux, build the project into single self-contained binary. Choose the right runtime
dotnet publish observe-entity-explorer.csproj --self-contained --runtime <linux-x64|win-x64> -p:PublishSingleFile=true -o bin/publish/entity-explorer

# For OSX, build the project into multiple files to be ran by dotnet command later. Choose the right runtime
dotnet publish observe-entity-explorer.csproj --self-contained --runtime <osx-x64|osx-arm64> -p:PublishSingleFile=false -o bin/publish/entity-explorer

# Run the application from where it was published to
bin/publish/entity-explorer/observe-entity-explorer & When application starts, it opens a web interface (default http://localhost:50110). Open that web site in your web browser:
./observe-entity-explorer

info: Microsoft.Hosting.Lifetime[0]
      Now listening on: http://localhost:50110
info: Microsoft.Hosting.Lifetime[0]
      Application started. Press Ctrl+C to shut down.
info: Microsoft.Hosting.Lifetime[0]
      Hosting environment: Production
info: Microsoft.Hosting.Lifetime[0]
      Content root path: <path...>\observe-entity-explorer.<version..>
You can change the port of the web site in Kestrel.Endpoints.Http.Url property in appsettings.json.
- Account can be either
- Full URL of the environment
https://#####.observeinc.com - Just customer ID of the environment
#####. Production URLobserveinc.comis assumed - Host name
#####.observeinc.comwithout https://
- Full URL of the environment
- Username
- Typically it is your email
- Password
- Specify your password
- Token
- Specify your API token if you have one issued to you
- OR
- Specify token taken from the GraphQL Bearer authentication in your browser session (not recommended)
- Delegate (must be > Reader)
- Log into Observe UI to approve your sign-in
- Return to this UI to complete sign-in

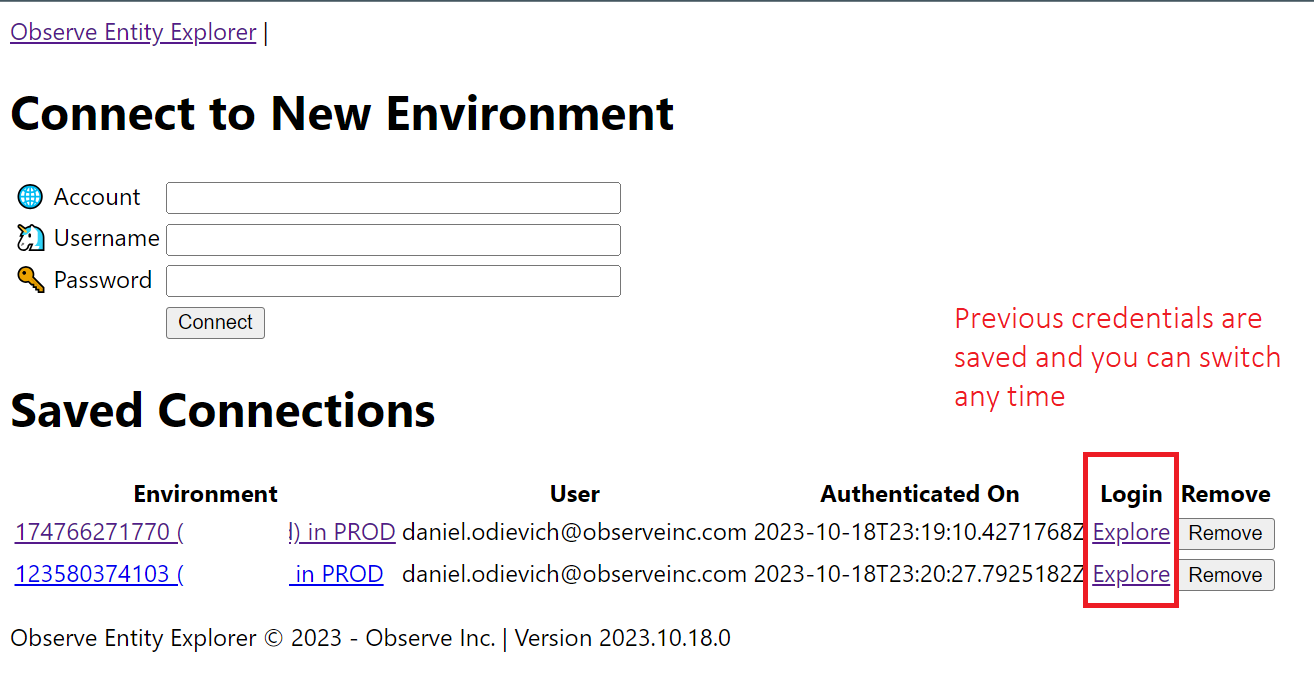
Your connections are saved in ~/.observe/observe-entity-explorer.auth-cache.json file. You can switch between them any time.
To connect with delegation, you must have > Reader role. If you have it:
- Specify account and username
- Click "Connect with Observe UI" button
- Click on "Go to Observe to approve login request link"
- In new browser window, authenticate into Observe
- Confirm your sign-in request on "Accounts Settings" page
- Back in Observe Entity Explorer, click "Check for Completion and Connect" button to finish signing in

You can open new tab with different connection ID and watch multiple accounts at once.
Summary screen shows numbers and types of entities in your Observe environment and links to the detail pages to get more information.
You can see entire tree of relationships of all objects in All Relationships button.
Finally you can search all OPAL in Search OPAL button (regex supported)

Datasets page lists all datasets grouped by type (DataStream, Event, Resource, Log, Metric, etc).
| Column | Description |
|---|---|
| View | Open the Dataset Detail page |
| Data | Open object page in Observe |
| Edit | Open object page in Observe in edit mode |
| Type | Type of object (Event, Resource, Interval) |
| Origin | What created this object (System, App, Terraform, User, DataStream) |
| ID | Object ID |
| Name | Object Name |
| Description | Description label, if present |
| Parts | Fields, primary and foreign keys, related keys |
| Uses | What this object uses as data inputs and data links |
| Used By | What uses this object (Data, Dashboard, Monitor) |
| Created | Who and when created this object |
| Updated | Who and when updates this object last |
| Transform 1h | credits_transform in last 1 hour |
| Transform 1d | credits_transform in last 1 day |
| Transform 1w | credits_transform in last 1 week |
| Query 1h | credits_adhoc_query in last 1 hour |
| Query 1d | credits_adhoc_query in last 1 day |
| Query 1w | credits_adhoc_query in last 1 week |
| Accel Conf. | Configured staleness target of the dataset |
| Accel Eff. | The target staleness of this dataset when taking downstream datasets |
| Accel Actl. | Staleness of the dataset (averaged over some moving window) |
| Accel Range | Actual accelerated range of the dataset |

Dashboards list all dashboards and their core statistics.
| Column | Description |
|---|---|
| View | Links to the Dashboard Detail page |
| Data | Open object page in Observe |
| Edit | Open object page in Observe in edit mode |
| Origin | What created this object (System, App, User) |
| ID | Object ID |
| Name | Object Name |
| Desc. | Description label, if present |
| Sections | Number of sections in dashboard |
| Widgets | Number of widgets in dashboard |
| Stages | Number of stages in dashboard |
| Parameters | Number of parameters in dashboard |
| Uses | What this object uses as data inputs and data links |
| Created | Who and when created this object |
| Updated | Who and when updates this object last |

Monitor (legacy) page shows all legacy monitors grouped by type (Metric, Log, Count, Promotion, Resource).
| Column | Description |
|---|---|
| View | Links to the Monitor (legacy) Detail page |
| Notif | Open notification list page in Observe |
| Edit | Open object page in Observe in edit mode |
| Type | Type of the monitor (Count, Promote, Threshold, Facet, Log) |
| Origin | What created this object (System, App, Terraform, User) |
| ID | Object ID |
| Name | Object Name |
| Comm. | Comment if it exists |
| Enabled | Is the monitor enabled |
| Actions | Number of actions in monitor |
| Stages | Number of stages in monitor |
| Uses | What this object uses as data inputs and data links |
| Created | Who and when created this object |
| Updated | Who and when updates this object last |
| Transform 1h | credits_monitor in last 1 hour |
| Transform 1d | credits_monitor in last 1 day |
| Transform 1w | credits_monitor in last 1 week |
| Accel Conf. | Configured staleness target of the dataset |
| Accel Eff. | The target staleness of this dataset when taking downstream datasets |
| Accel Actl. | Staleness of the dataset (averaged over some moving window) |
| Accel Range | Actual accelerated range of the dataset |

Monitors v2 page shows all new type monitors grouped by type (Metric, Count, Resource).
| Column | Description |
|---|---|
| View | Links to the Monitor v2 Detail page |
| Edit | Open object page in Observe in edit mode |
| Type | Type of the monitor (Count, Promote, Threshold) |
| Origin | What created this object (System, App, Terraform, User) |
| ID | Object ID |
| Name | Object Name |
| Comm. | Comment if it exists |
| Enabled | Is the monitor enabled |
| Actions | Number of actions in monitor |
| Stages | Number of stages in monitor |
| Uses | What this object uses as data inputs and data links |
| Created | Who and when created this object |
| Updated | Who and when updates this object last |
| Transform 1h | credits_monitor in last 1 hour |
| Transform 1d | credits_monitor in last 1 day |
| Transform 1w | credits_monitor in last 1 week |

Worksheets page shows all user worksheets.
| Column | Description |
|---|---|
| View | Links to the Worksheet Detail page |
| Data | Open object page in Observe in data/edit mode |
| Origin | What created this object (System, App, Terraform, User) |
| ID | Object ID |
| Name | Object Name |
| Stages | Number of stages in worksheet |
| Stages | Number of parameters in worksheet |
| Uses | What this object uses as data inputs and data links |
| Created | Who and when created this object |
| Updated | Who and when updates this object last |

Role based access control settings for users, groups and statements.

Role based access control memberships.

Code search results show OPAL with hits highligted. You can show and hide all the code stages, and also navigate to the detail pages.

Summary information about the dataset.

Dataset acceleration settings.

List of all objects feeding data into this dataset.

List of all objects using data from this dataset.

Visual diagram showing relationship between datasets and dashboards related to this dataset.
Information about each stage in the dataset. You can click "Show/Hide input and output tables" to remove details and just focus on OPAL code.

This table is followed by the repeated sections for each stage, containing:

Visual diagram showing relationship between inputs and stages of this dataset.

List of all dashboards using this dataset.

List of all monitors (legacy) using this dataset.

List of all worksheets using this dataset.

Summary information about the dashboard.

List of all objects feeding data into this dashboard.

List of all objects using data from this dataset.
Visual diagram showing relationship between datasets related to this dashboard.

Information about each parameter in the dashboard.

Information about each stage in the dashboard. You can click "Show/Hide input and output tables" to remove details and just focus on OPAL code. You can click "Show/Hide dashboard widget image preview" to remove images and just focus on OPAL code.

This table is followed by the repeated sections for each stage, containing:

Visual diagram showing relationship between inputs and stages of this dashboard.

Summary information about the monitor (legacy).

List of all objects providing data to this monitor.

List of all objects supporting this monitor.

Visual diagram showing relationship between datasets related to this monitor.

Summary information about the monitor v2.

Visual diagram showing relationship between datasets related to this monitor.

Summary information about the worksheet.

Datastreams list.
| Column | Description |
|---|---|
| View | Links to the Dataset Details page for the dataset of this datastream |
| Data | Open datastream dataset data page |
| Edit | Open datastream page |
| Origin | What created this object (System, App, Terraform, User) |
| ID | Object ID |
| Name | Object Name |
| Description | Comment if it exists |
| Enabled | Is the datastream enabled |
| Tokens | Number of tokens in datastream |
| Retention | Retention setting in days |
| Bytes | Bytes ingested in last hour |
| GB | Gigabytes ingested in last hour |
| TB | Terabytes ingested in last hour |
| Created | Who and when created this object |
| Updated | Who and when updates this object last |
Tokens list.
| Column | Description |
|---|---|
| Data | Open datastream dataset data page filtered to this token |
| Edit | Open datastream page |
| Origin | What created this object (System, App, Terraform, User) |
| Datastream | Datastream this token sends data to |
| Type | Type of token (token, poller, filedrop) |
| ID | Object ID |
| Name | Object Name |
| Description | Comment if it exists |
| Enabled | Is the datastream enabled |
| Tokens | Number of tokens in datastream |
| Bytes | Bytes ingested in last hour |
| GB | Gigabytes ingested in last hour |
| TB | Terabytes ingested in last hour |
| Start Ingest | When ingestion started |
| Last Ingest | Last time data was received |
| Last Error | Last time there was an error receiving data |
| Created | Who and when created this object |
| Updated | Who and when updates this object last |

Logs are in /logs subfolder below where your application is installed with new files created every day:
logs\Observe.EntityExplorer.Console.2023-10-18.log
logs\Observe.EntityExplorer.Main.2023-10-18.log
logs\Observe.EntityExplorer.ObserveConnection.2023-10-18.log