This README gives a high level overview of what Pretzel can do. More detailed documentation is being developed at https://docs.plantinformatics.io/.
Pretzel is a web-based online framework for the real-time interactive display integration of genetic and genomic datasets. It is built on Ember.js (front end), Loopback.js (back end) and D3.js (visualisation).
Agriculture Victoria hosts the following Pretzel instances for the following species for public datasets:
| Species | URL |
|---|---|
| Wheat | https://plantinformatics.io/ |
| Pulses | https://pulses.plantinformatics.io/ |
| Barley | https://barley.plantinformatics.io/ |
Users can sign up for an account by following the Sign Up links in the top right of the page.
-
Integration of a diverse range of genetic and genomic information
-
Genetic map and chromosome-scale genomic assembly alignments
-
Visualisation of genomic features, including genes, markers and QTLs
-
Genotype data visualisation, filtering, dataset intersection
-
Searching by feature/marker name or by sequence (when BLAST database set up)
-
Ability to upload custom datasets by drag and dropping Excel templates
-
User-defined access controls on uploaded datasets, including sharing to groups of users
-
Dynamic link to Crop Ontology API for QTL trait definition and visualisation
Simultaneously investigating genome to genetic map relationships and zooming to specific regions to visualize genomic features
IWGSC RefSeq v1.0 genome assembly chromosome 7A zoomed around the RAC875_c1277_250 90k marker, with 90k markers (blue) and HC genes (purple) shown (left axis), aligned to the 8-way MAGIC genetic map (Shah et al. 2018, middle axis) and Avalon x Cadenza genetic map (Wang et al. 2014, right axis). The table shows relative position of markers in the genome assembly and MAGIC map.
Visualising chromosome-scale alignments between a genetic map to a genome assembly and syntenic relationships between different species' genomes
Westonia x Kauz genetic map based on 90k markers (Wang et al. 2014, left axis) aligned to IWGSC RefSeq v1.0 chromosome 2A (middle axis), aligned to barley Morex V2 assembly (right axis) with red lines between orthologous genes between wheat and barley.
TaCOL-B5 marker position from Zhang et al. 2022 positioned in IWGSC RefSeq v1.0 chromosome 2A (left axis), aligned to SSR map from Shankar et al. 2017 with 3 QTLs shown in blue (right axis).
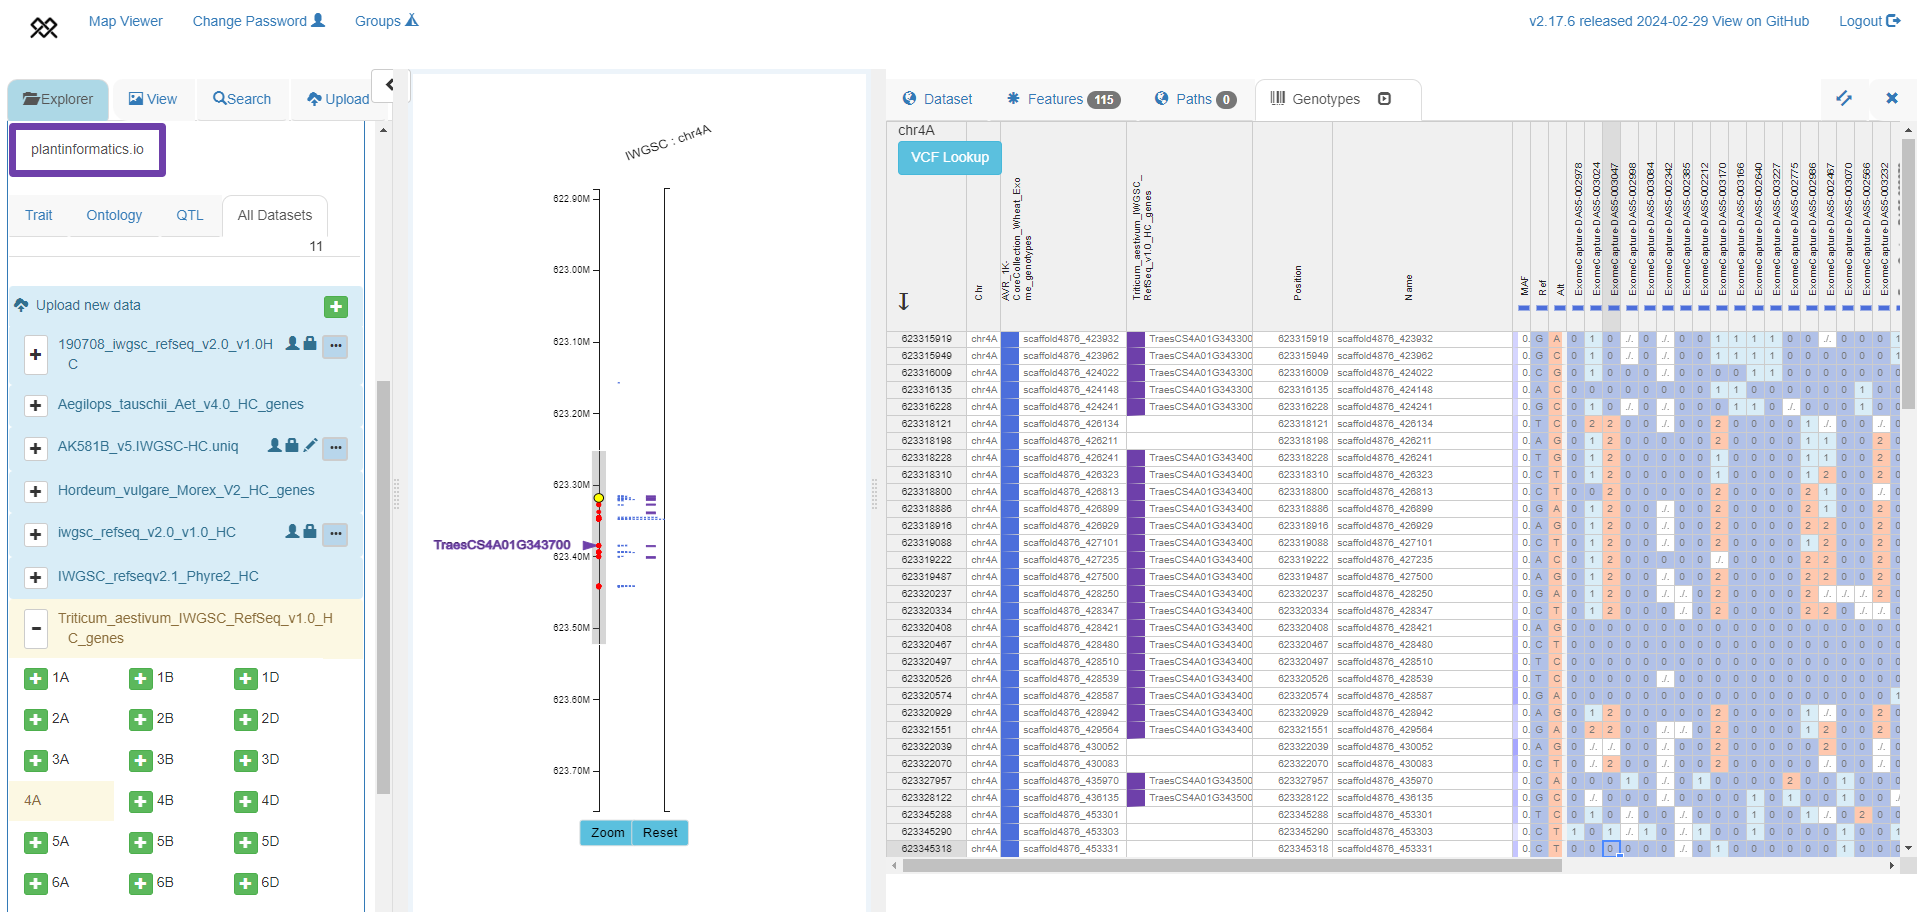
Exome-based haplotypes (right panel) from a subset of accessions from Keeble-Gagnere et al. 2021 (https://doi.org/10.7910/DVN/5LVYI1), with SNP positions shown around TraesCS4A01G343700 in IWGSC RefSeq v1.0 (left panel).
Currently (2022-) funded as part of the Australian Grains Genebank Strategic Partnership, a $30M joint investment between the Victorian State Government and Grains Research and Development Corporation (GRDC) that aims to unlock the genetic potential of plant genetic resources for the benefit of the Australian grain growers. https://agriculture.vic.gov.au/crops-and-horticulture/the-australian-grains-genebank
Between 2020-2022 funded and developed by Agriculture Victoria, Department of Jobs, Precincts and Regions (DJPR), Victoria, Australia.
Between 2016-2020 funded by the Grains Research Development Corporation (GRDC) and co-developed by Agriculture Victoria and CSIRO, Canberra, Australia.


