-
Notifications
You must be signed in to change notification settings - Fork 77
New issue
Have a question about this project? Sign up for a free GitHub account to open an issue and contact its maintainers and the community.
By clicking “Sign up for GitHub”, you agree to our terms of service and privacy statement. We’ll occasionally send you account related emails.
Already on GitHub? Sign in to your account
TH2D draw options "VIOLIN" and "CANDLE" not supported in jsroot? #194
Comments
|
Hi, CANDLE plot is partially implemented: https://root.cern/js/latest/examples.htm?more#th2_candle VIOLIN is not supported yet. Both options are not trivial, while require different statistical calculations. |
Hello, thank you for the quick reply! If CANDLE works then that is good enough for our usecase I think. Could you please elaborate on how it is limited, given its partial implementation? Thanks for this great tool that is jsroot, by the way! |
See here: I implement CANDLE options while ago, now in ROOT there are much more details can be configured with CANDLE drawing. One should adopt actual code from TCandle class into JSROOT. |
|
From the source code, it is not very obvious to me how to achieve the drawing of a plot like the one you showed in the example. What we are doing is generating root files in pyroot, which are then fed to the jsroot browser. If I do histogram.Draw("CANDLEX(11111111)") in pyroot and then display that file the jsroot browser, many of the essential features (that are present in your example) are missing. Could you please provide the parameters or method that was used to achieve a result like in your example? Thanks in advance! |
|
Once again - many features of CANDLE plot not implemented in JSROOT. |
|
https://jsroot.gsi.de/dev/examples.htm#candle_stack |
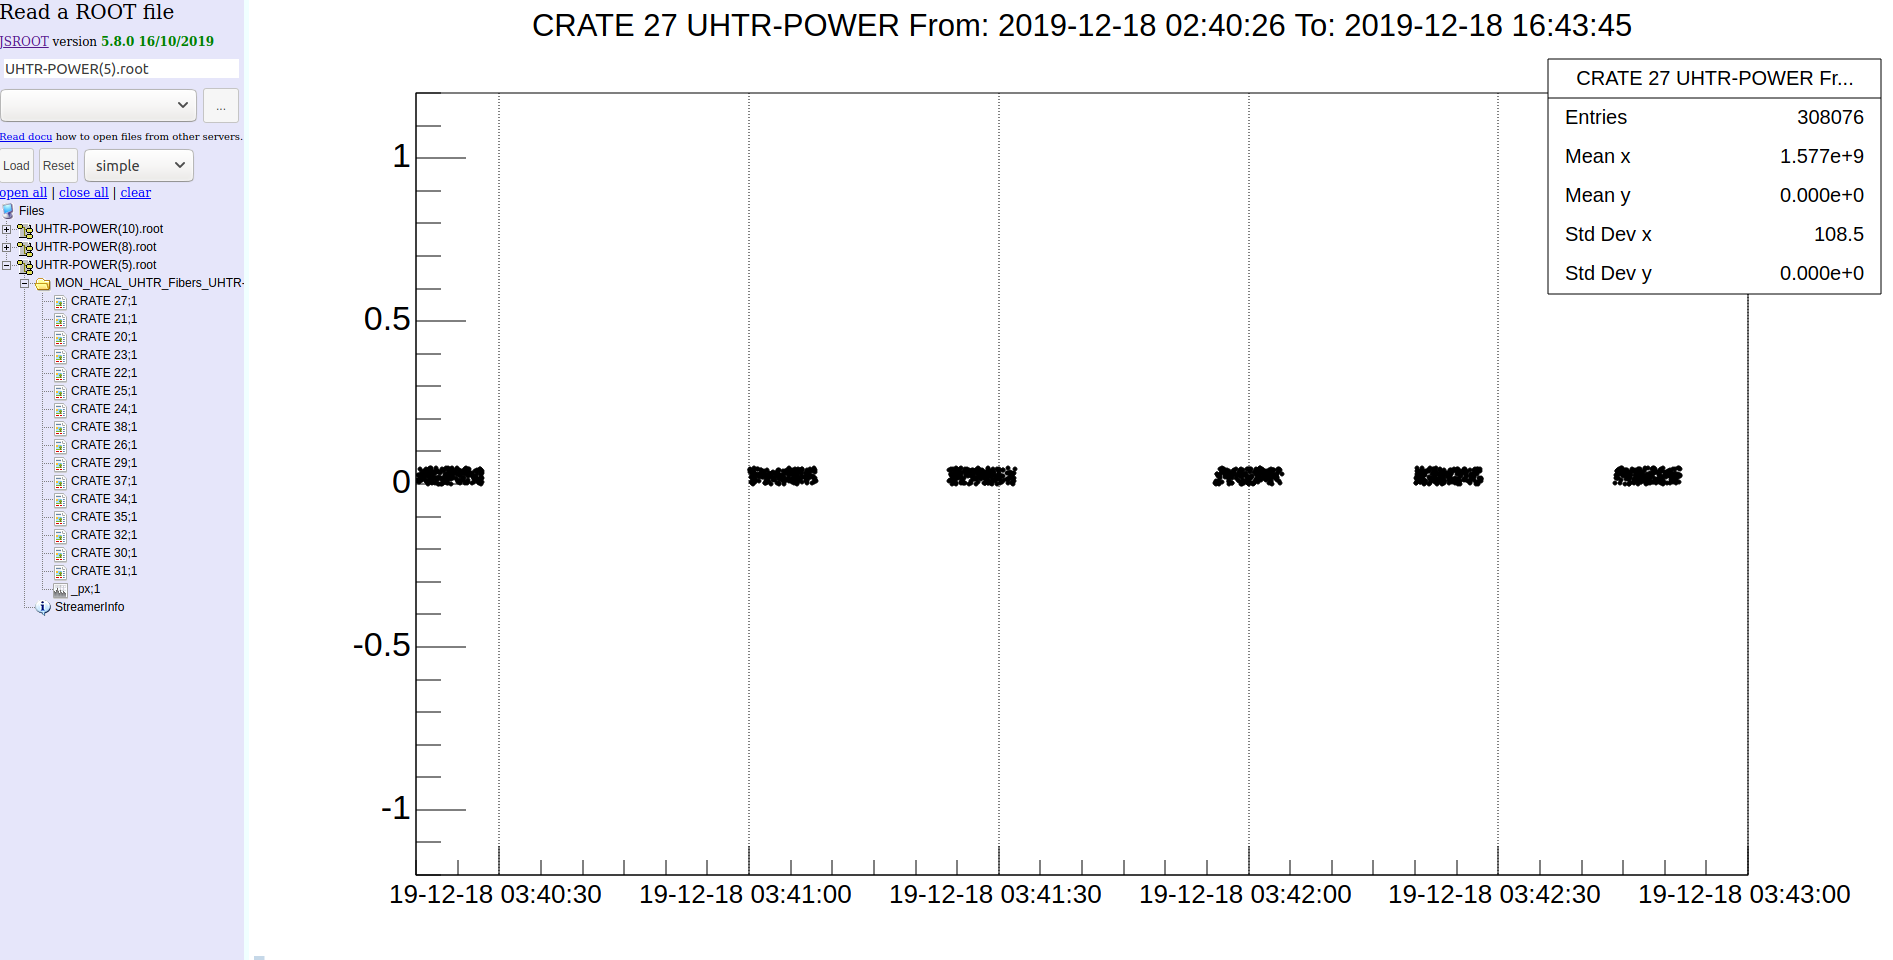
Using http://jsroot.gsi.de/latest/, if I open a TH2D drawn with the "VIOLIN" or "CANDLE" option, it fails to display properly.
What is shown:

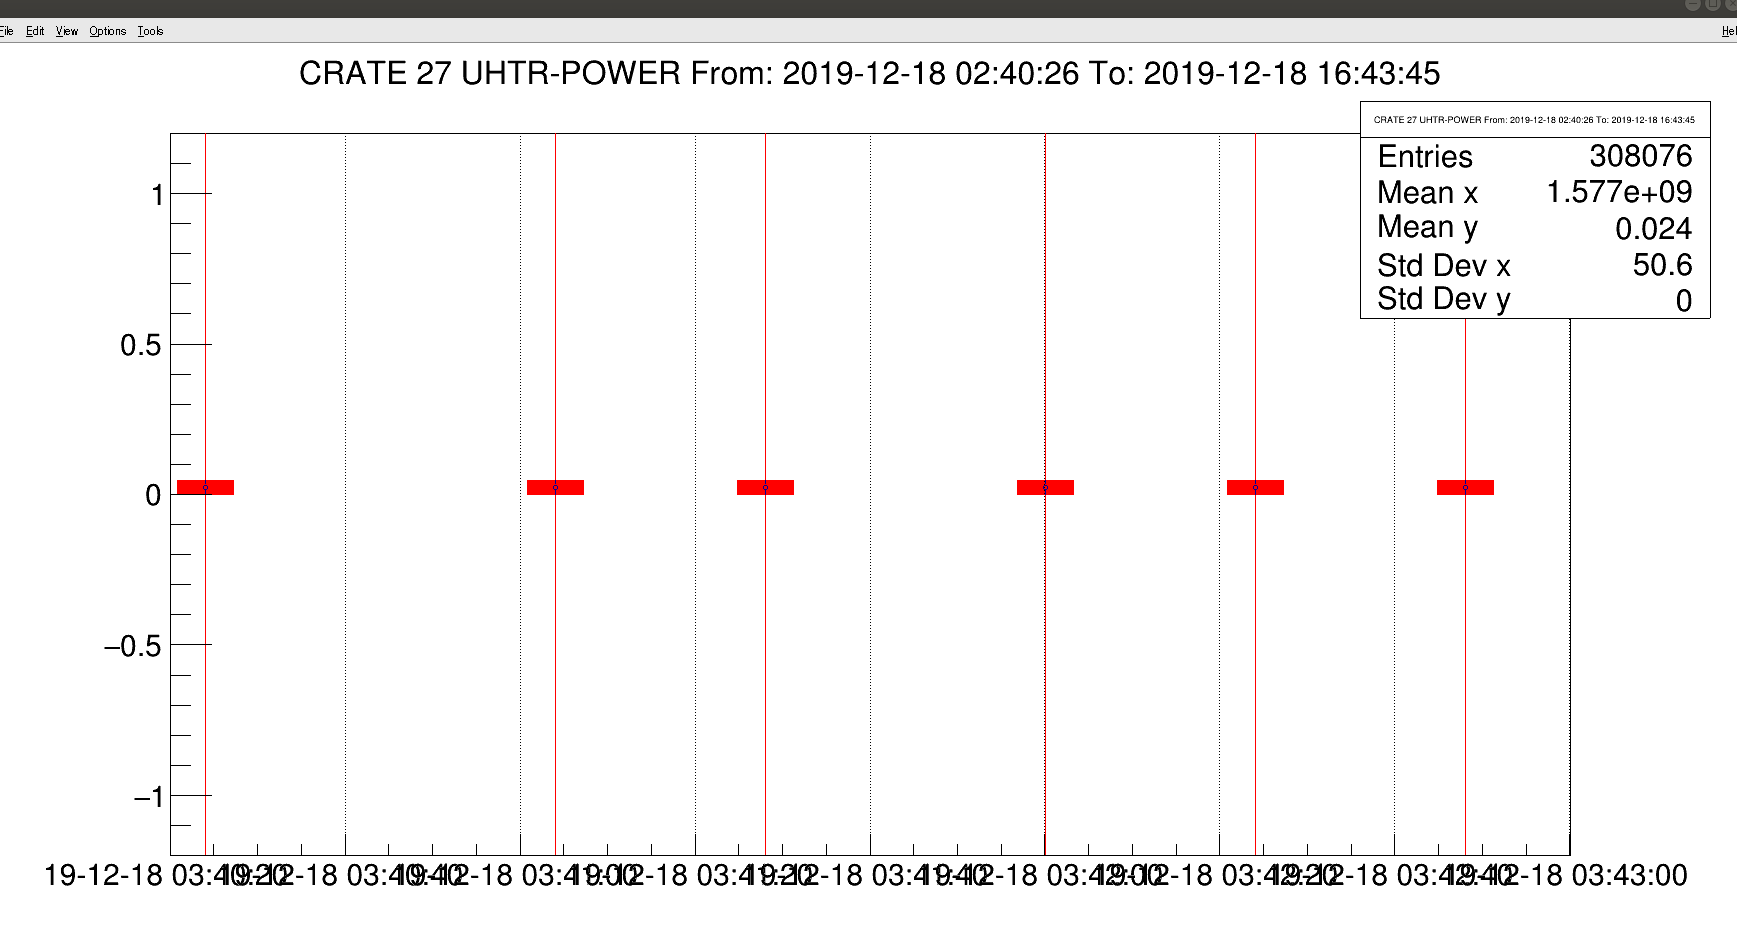
Expected behavior as seen in desktop root:

Link to the root file in question
Is there any method how to make this work or are there plans to fix this? Thanks!
The text was updated successfully, but these errors were encountered: