-
-
Notifications
You must be signed in to change notification settings - Fork 467
New issue
Have a question about this project? Sign up for a free GitHub account to open an issue and contact its maintainers and the community.
By clicking “Sign up for GitHub”, you agree to our terms of service and privacy statement. We’ll occasionally send you account related emails.
Already on GitHub? Sign in to your account
Severe memory leak when displaying MarkerArrays with current hydro rviz from .debs #695
Comments
|
Testing bag file: https://drive.google.com/file/d/0B1hU91jkd7VweHFpQVlyejVXUUE/edit?usp=sharing Just play back rosbag play rviz_issue_695_marker_array.bag -l --clock start rviz, set fixed frame to "world" and see how computer slows to a crawl within less than a minute. Note the bag publishing can be stopped/paused as soon as rviz received the first message and memory leak will continue. |
|
Similar report is posted here. I'd also like to add another experience, but with Groovy version and haven't been able to reproduce it since it only happened once in three weeks of running RViz all day long. |
|
Valgrind memcheck log when playing back above linked bagfile to an rviz in Debug mode can be found here: https://drive.google.com/file/d/0B1hU91jkd7VwZFVtNFJtX25rVDg/edit?usp=sharing. There is no obvious large leak visible there however, so it looks like the huge amount of memory used gets properly released on shutdown. |
|
Google perftools output: https://drive.google.com/file/d/0B1hU91jkd7VweGFIQkl2YUQ0dVU/edit?usp=sharing |
|
In my experience the memory does indeed get released when closing rviz. |
|
can anybody please try out #704 ? It definitely improved things for me. |
|
Looks good to me, could run rviz after publishing above test bagfile for extended periods of time without issues (as described, would easily fill my 16GB of RAM in less than a minute before the change). |
|
That fix works for point clouds and anything that uses it for display (like an octomap grid). |
|
Fixed by #704 |
|
I am trying to develop a tool to visualise similar tool like rviz for visualising bag files og 10-20 GB size. And as expected it is creating memory leakage and it is either freezing or giving segmentation fault. Any idea how did rviz community solved this issue? |
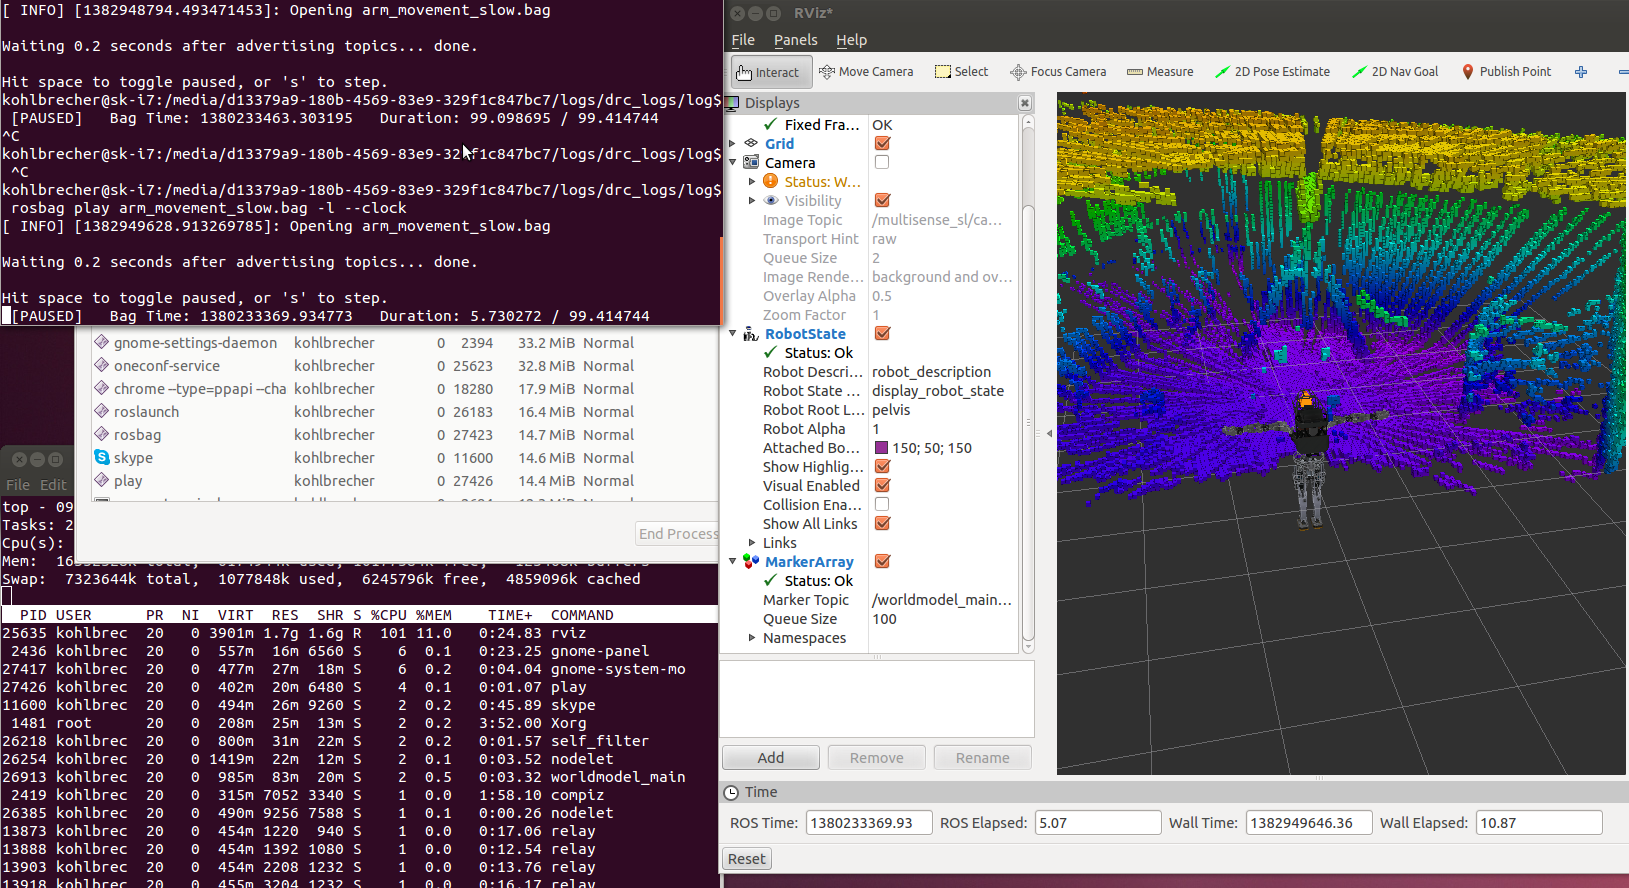
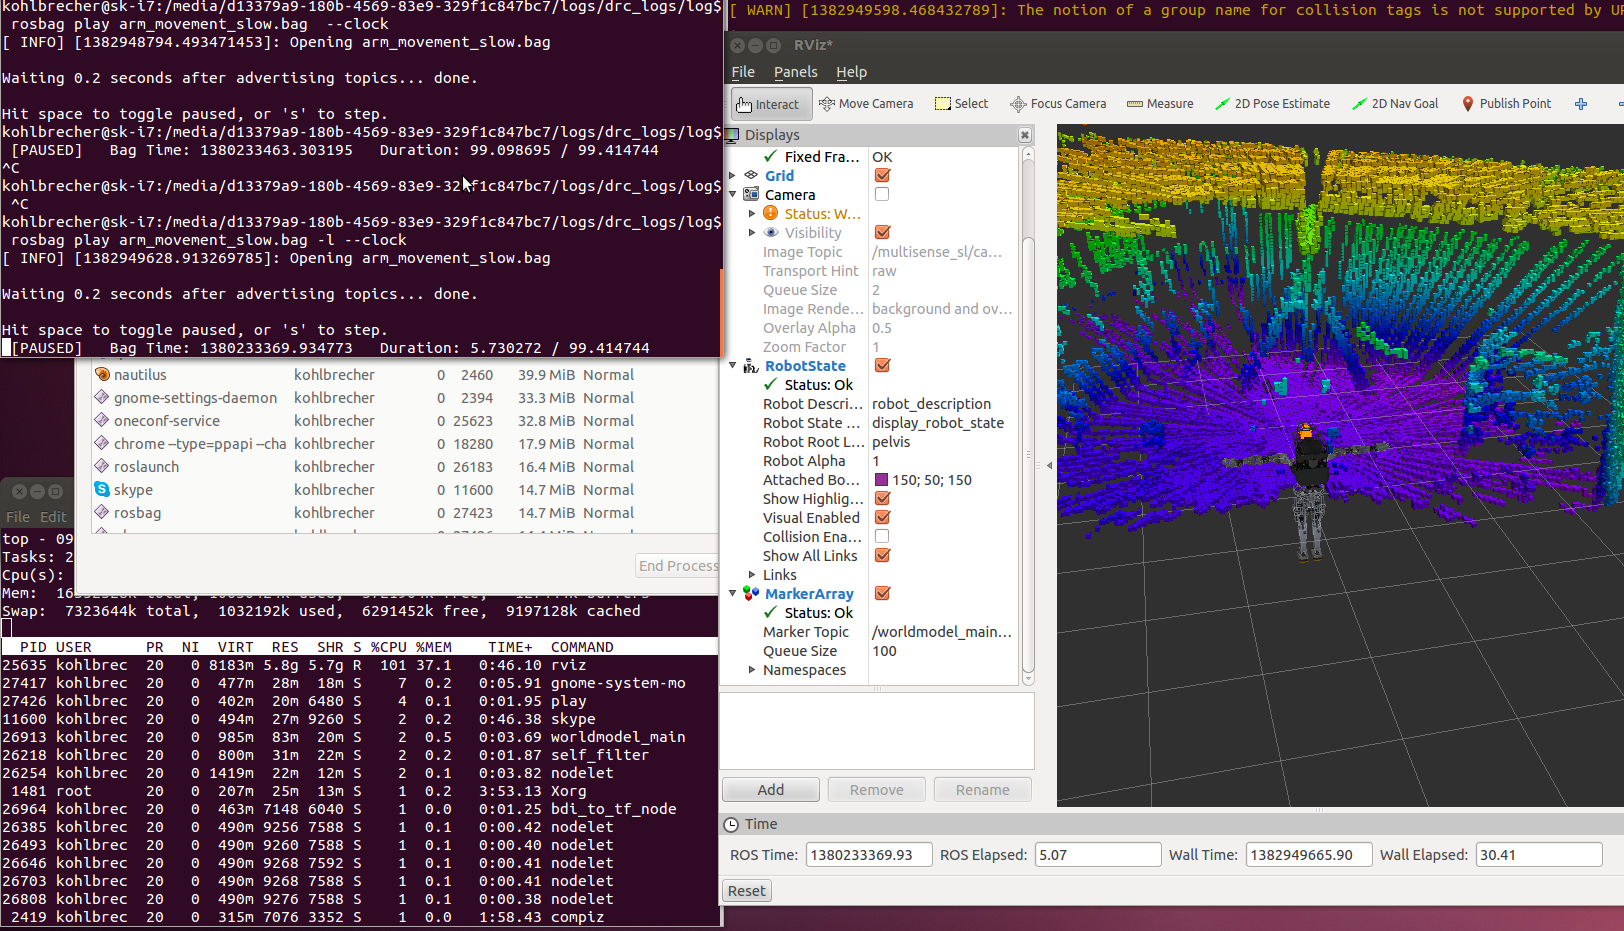
I get severe leaking when displaying a MarkerArray using the hydro version of rviz installed from .debs (12.04, AMD64). Displaying a MarkerArray for a octomap, memory gets filled up at a rate of about 2 GB in 10 seconds. See attached images below. I transmitted a MarkerArray based octomap visualization and paused playing my bagfile. Time does not advance and no new MarkerArray data gets published. With the hydro version of rviz, the following happens:


The interesting parts are the memory consumption in "top" (left) and the ROS wall time in rviz (right).
The rviz version available from .debs in groovy does not exhibit this behavior and performs as expected.
The text was updated successfully, but these errors were encountered: