Original Demo
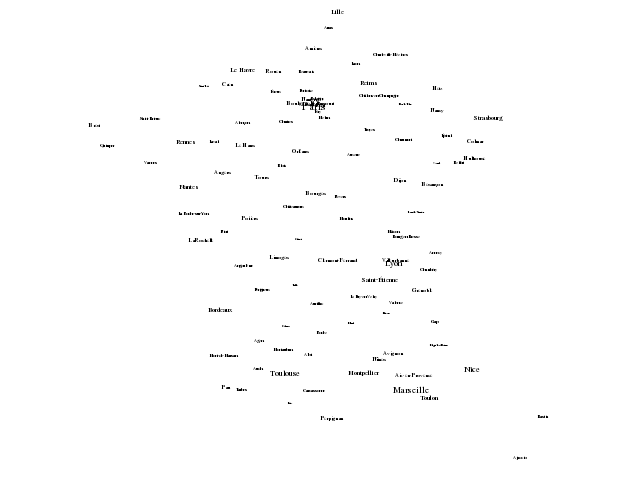
# # Demonstrates how to derive variable font size from a data file column.
# #
# # If you are viewing this via the HTML canvas terminal, be sure to toggle
# # the font scaling icon so that the fonts change size as you zoom in.
# #
# Scale(size) = 0.25*sqrt(sqrt(column(size)))
# CityName(String,Size) = sprintf("{/=%d %s}", Scale(Size), stringcolumn(String))
#
# set termoption enhanced
# set encoding utf8
# unset xtics
# unset ytics
# unset key
# set border 0
# set size square
# set datafile separator "\t"
# plot 'cities.dat' using 5:4:($3 < 5000 ? "-" : CityName(1,3)) with labels

Numo.gnuplot do
  run "Scale(size) = 0.25*sqrt(sqrt(column(size)))"
  run "CityName(String,Size) = sprintf(\"{/=%d %s}\", Scale(Size), stringcolumn(String))"
  set :termoption, :enhanced
  set encoding:"utf8"
  unset :xtics
  unset :ytics
  unset :key
  set border:0
  set size:"square"
  set :datafile, :separator, "\t"
  plot "'cities.dat'", using:'5:4:($3 < 5000 ? "-" : CityName(1,3))', with:"labels"
end