| Parameter | Default | Description |
|---|---|---|
| p | 0.5. | The probability of a success on an individual trial. |
| size | 1000 | The Number of random variables. |
| fig_w | 8 | Matplotlib figsize width. |
| fig_l | 8 | Matplotlib figsize length. |
| grid | True | Use 'True' or 'False' to show the grid. |
| color | 'skyblue' | The color to fill. |
| linewidth | 10 | The line width. |
| alpha | 1 | The alpha(transparency) value for filling color. |
| title | 'Bernoulli Distribution' | The figure's title. |
| xlabel | 'Bernoulli Distribution' | The x-axis label. |
| ylabel | 'Frequency' | The y-axis label. |
| legend_size | 12 | The legend font size. |
| title_size | 20 | The title font size. |
| label_size | 16 | The label font size. |
| tick_size | 12 | x and y axis tick font size. |
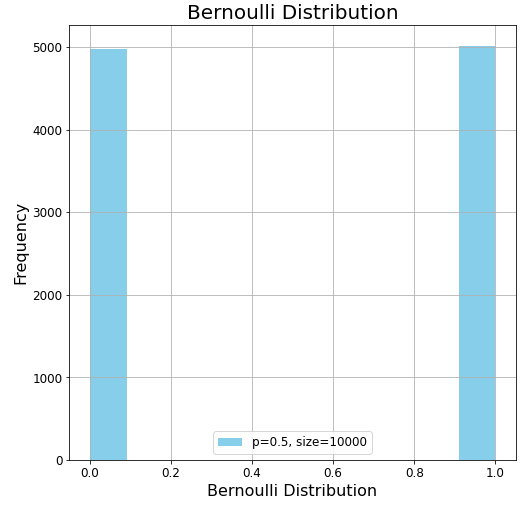
bernofig(size=10000)
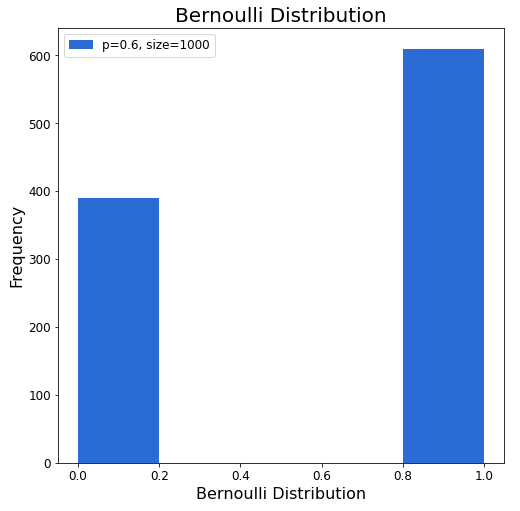
bernofig(p=0.6, color='#2a6bd4', grid=False)