| Parameters | Default | Description |
|---|---|---|
| info | {'bplot 1':[-9, -4, 2, 4, 9], 'bplot 2':[-5, -2, 1, 3, 8], 'bplot 3':[1, 4, 6, 8, 10]} | Input your label and data in a dictionary form. |
| vert | True | If True (default), makes the boxes vertical. If False, everything is drawn horizontally. |
| fill_color | True | If False produces boxes with the Line2D artist. Otherwise, boxes and drawn with Patch artists. |
| mycolor | ['pink', 'lightblue', 'lightgreen', 'lightsalmon', 'lightseagreen', 'lightgrey'] | You can add your colors, ['red','blue'] |
| fig_w | 8 | Matplotlib figsize width. |
| fig_l | 8 | Matplotlib figsize length. |
| grid | True | Use 'True' or 'False' to show the grid. |
| title | 'Bernoulli Distribution' | The figure's title. |
| xlabel | 'Bernoulli Distribution' | The x-axis label. |
| ylabel | 'Frequency' | The y-axis label. |
| title_size | 20 | The title font size. |
| label_size | 16 | The label font size. |
| tick_size | 12 | x and y axis tick font size. |
import statsfig as sf

sf.boxplot()
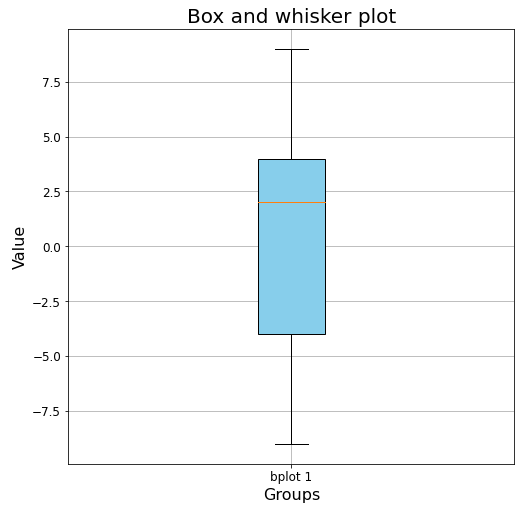
info={'bplot 1':[-9, -4, 2, 4, 9]}
sf.boxplot(info, mycolor=['skyblue'])
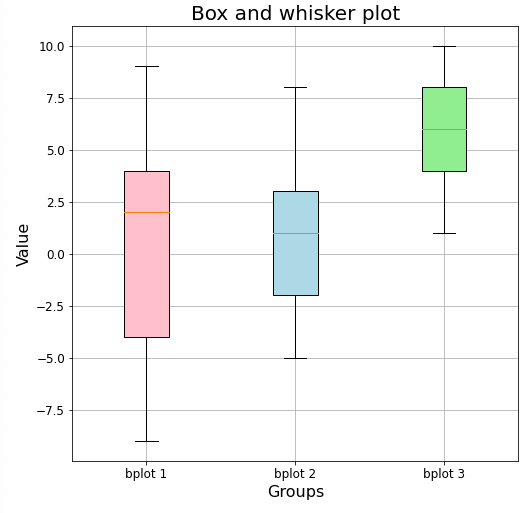
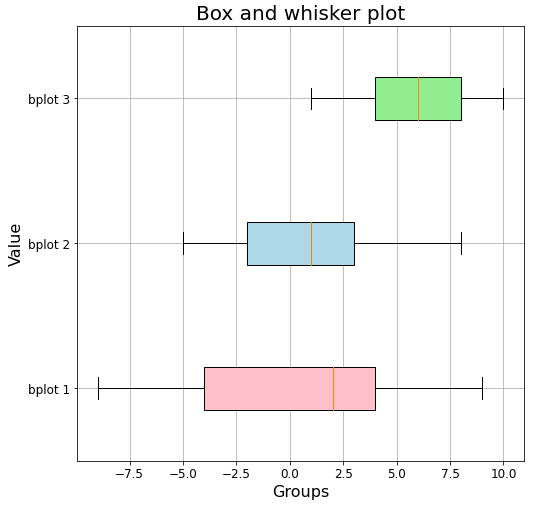
info={'bplot 1':[-9, -4, 2, 4, 9], 'bplot 2':[-5, -2, 1, 3, 8], 'bplot 3':[1, 4, 6, 8, 10]}
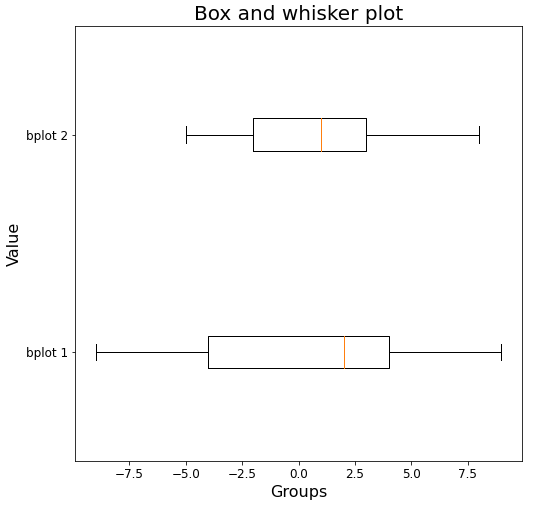
sf.boxplot(info, vert=False)
sf.boxplot(info, vert=False, fill_color=False)