| Parameter | Default | |
|---|---|---|
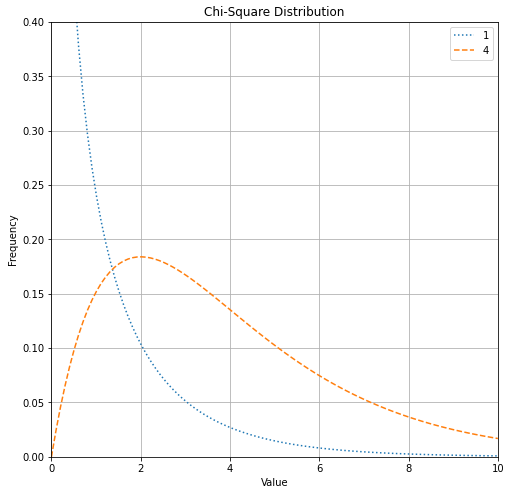
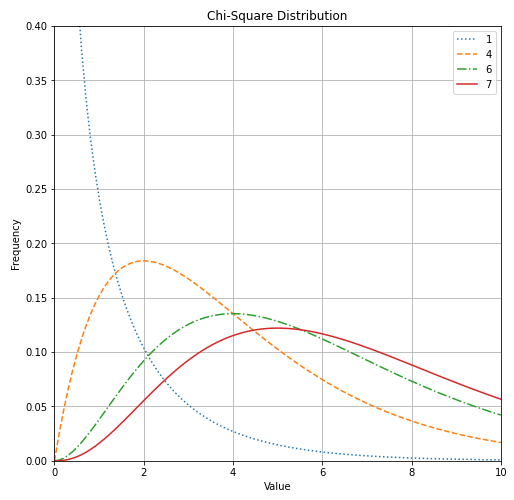
| dof | [1,4,6,7] | Degree of freedoms to display |
| fig_w | 8 | Matplotlib figsize width |
| fig_l | 8 | Matplotlib figsize length |
| grid | True | Use 'True' or 'False' |
| title | 'Chi-Square Distribution' | The figure's title. |
| xlabel | 'Value' | The x-axis label. |
| ylabel | 'Frequency' | The y-axis label. |
| legend_size | 12 | The legend font size. |
| title_size | 20 | The title font size. |
| label_size | 16 | The label font size. |
| tick_size | 12 | The x and y axis tick font size. |
import statfig as sf

sf.chifig()
sf.chifig(dof=[1,4])