forked from TuorlaObservatory/CompCoffee
-
Notifications
You must be signed in to change notification settings - Fork 0
/
Copy pathslides.html
311 lines (273 loc) · 10.5 KB
/
slides.html
1
2
3
4
5
6
7
8
9
10
11
12
13
14
15
16
17
18
19
20
21
22
23
24
25
26
27
28
29
30
31
32
33
34
35
36
37
38
39
40
41
42
43
44
45
46
47
48
49
50
51
52
53
54
55
56
57
58
59
60
61
62
63
64
65
66
67
68
69
70
71
72
73
74
75
76
77
78
79
80
81
82
83
84
85
86
87
88
89
90
91
92
93
94
95
96
97
98
99
100
101
102
103
104
105
106
107
108
109
110
111
112
113
114
115
116
117
118
119
120
121
122
123
124
125
126
127
128
129
130
131
132
133
134
135
136
137
138
139
140
141
142
143
144
145
146
147
148
149
150
151
152
153
154
155
156
157
158
159
160
161
162
163
164
165
166
167
168
169
170
171
172
173
174
175
176
177
178
179
180
181
182
183
184
185
186
187
188
189
190
191
192
193
194
195
196
197
198
199
200
201
202
203
204
205
206
207
208
209
210
211
212
213
214
215
216
217
218
219
220
221
222
223
224
225
226
227
228
229
230
231
232
233
234
235
236
237
238
239
240
241
242
243
244
245
246
247
248
249
250
251
252
253
254
255
256
257
258
259
260
261
262
263
264
265
266
267
268
269
270
271
272
273
274
275
276
277
278
279
280
281
282
283
284
285
286
287
288
289
290
291
292
293
294
295
296
297
298
299
300
301
302
303
304
305
306
307
308
309
310
311
<!DOCTYPE html>
<html>
<head>
<title>Introduction to R</title>
<meta charset="utf-8" />
<link href="https://cdn.rawgit.com/Ilia-Kosenkov/UTU-slides/81794612/style.css" rel="stylesheet" type="text/css">
<link href="https://fonts.googleapis.com/css?family=Open+Sans+Condensed:300" rel="stylesheet">
</head>
<body>
<textarea id="source">
layout: true
---
class: title-slide, utu-back-title
# Introduction to `R`
---
class: utu-back-content
# What is `R`?
As stated in the [manual for beginners](https://cran.r-project.org/doc/manuals/r-release/R-intro.pdf) found at the **C**omprehensive **R** **A**rchive **N**etwork, `R` is
- An effective data handling and storage facility,
- a suite of operators for calculations on arrays, in particular matices
- a large, coherent, integrated collection of intermediate tools for data analysis,
- graphical facilities for data analysis and display either directly at the computer or on hard-copy,
- a well developed simple and effective programming language (called `S`) which includes conditionals, loops, user defined recursive functions and input and output facilities
---
class: utu-back-content
# What is `R`?
- It is **free** and available for all major OS.
- `R` is an `interpreted` language.
- `R` itself is a rather 'modern' **GNU** implementation of `S` language, which in turn was developed by *Bell Laboratories*. The first stable beta version was released around 2000.
- Part of `R` functions are written in `R` itself and make it easy to understand, part are written in `C`, `FORTRAN` and other languages for the sake of the performance (mostly computational parts). There is a toolchain for building `R \(\leftrightarrow\) C` interoperable libraries.
- `R` can be extended through *packages* that can be installed from different centralized repositories (`CRAN`, `MRAN` and mirrors), directly from directories on local machine, from *`git` repos and from many other sources.
---
class: utu-back-content
# Basic concepts
- There are several base types in `R`, `integer`, `double`, `character`, `complex`, `factor` and `logical`. It is safe to say that everything in `R` is a first-class object
- The simplest collection is a `vector` - a group of objects of the same type. Any standalone primitive object (like number 2.0) is itself a `vector` of size **1**.
- Matricies are arrays of higher order (rectangular), lists are general collections of any objects of any types, data frames are data-base like tables with columns of equal length but different type. Another type, part of the `tidyverse` package, `tibble` extends functions of data frames.
- Higher order types can be defined using class systems (I am aware of several, `S3`, `S4`, `Reference classes` and `S6`)
---
class: utu-back-content
# Examples: Run interactively
.double-column[
.column[
```R
> x <- 5 # Assigns 5 (double) to x
> x # Prints x, equivalent to print(x)
# [1] 5
> x[1] # Accesses 1st element of a vector
# [1] 5
> y <- list(x, "Hello world") # A list
> y
# [[1]]
# [1] 5
#
# [[2]]
# [1] "Hello world"
> a <- 1:7 # Integer range from 1 to 7
> a ^ 2 # Vectorized power operation
# [1] 1 4 9 16 25 36 49
> mean(a ^ 2) # Calls built-in stat. mean
# [1] 38.5
> sd (a ^ 2) # Standard deviation
# [1] 34.17358
```
]
.column[
```R
> sprintf("Compare %3.2f to %3.2e", 0.0123, 0.0123)
# [1] "Compare 0.01 to 1.23e-02"
> quantile(rnorm(n = 100, mean = 0, sd = 3),
+ probs = c(0.16, 0.84))
# 16% 84%
# -3.191771 2.949907
> f <- function(x) {
+ mn <- mean(x)
+ s <- sd(x)
+ rng <- range(x)
+ return(c(mn, s, rng))
+}
> f(c(10, 20, 30, 123, 0.06, -100))
# [1] 13.84333 71.24490 -100.00000 123.00000
> z <- 0
> for (i in 1:100) z <- z + i; print(z)
# [1] 5050
> sum(1:100)
# [1] 5050
```
]
]
---
class: utu-back-content
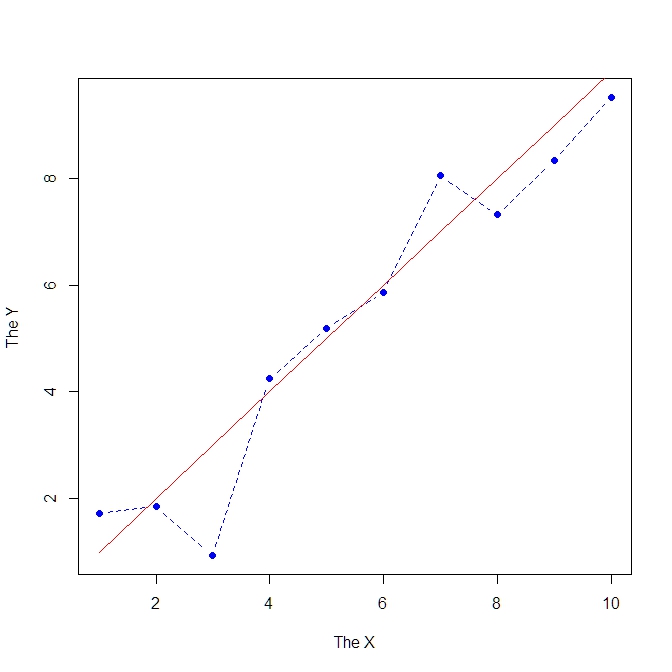
# Examples: Get help & make a plot
.column[
```R
> f # Type the name of previously defined func
# function(x) {
# mn <- mean(x)
# s <- sd(x)
# rng <- range(x)
# return(c(mn, s, rng))
# }
> ?mean # Opens local web page with manual
> data <- data.frame(x = 1:10,
+ y = 1:10 + rnorm(10))
> plot(data$x, data$y, type = "b",
+ pch = 19, lty = 2, col = "blue",
+ xlab = "The X", ylab = "The Y")
> lines(1:10, 1:10, lty = 1, col = "#FF0000")
> data[1:2, ]
# x y
# 1 1 1.721106
# 2 2 1.848209
> quit("no")
```
]
.top[.right[
]]
---
class: utu-back-content
# Examples: Install `JAGS` and get some packages
- `JAGS` can be found [here](http://mcmc-jags.sourceforge.net/)
- We need `rjags` to run `JAGS` from `R`, `tidyverse` (optional) to use fancy data manipulation facilities.
```R
> install.packages(c("rjags", "tidyverse")) # Installs two packages
> library(rjags) # Loads rjags, can be used without quotes
> library(tidyverse) # All useful data processing tools
```
- Now check out code examples (demo)
---
class: utu-back-content
# More useful examples
.double-column[
.column[
Assignment operators:
```R
<- and -> are default operators
= is used with named func. arguments
<<- and ->> are global assignment ops.
> getwd() # Returns current working directory
# [1] "\path\to\current\dir"
> setwd("\path\to\new\dir") # Sets work dir
```
Loop alternatives
```R
apply, lapply, sapply, vapply
> sapply(1:5, function(x) (x + 1) ^ 2)
# [1] 4 9 16 25 36
```
]
.column[
```R
> library(foreach)
> foreach(i = 1:2) %do% { i ^ 2}
# [[1]]
# [1] 1
#
# [[2]]
# [1] 4
> library(parallel)
> library(doSNOW)
> cl <- makeCluster(2, "SOCK")
> registerDoSNOW(cl)
> foreach(...) %dopar% {...}
> stopCluster(cl)
```
```R
> file.path("dir1", "dir2")
# "dir1/dir2"
```
]
]
---
class: utu-back-content
# More useful examples
.double-column[
.column[
```R
> paste("d", c("x", "y", "z"), sep = "_")
# [1] "d_x" "d_y" "d_z"
> substring("Hello World!", 7, 11)
# [1] "World"
> grepl("[W|w]o.*!$",
+ c("World!", "world!", "world"))
# [1] TRUE TRUE FALSE
> c(5 / 2, 5 %% 2, 5 %/% 2)
# [1] 2.5 1.0 2.0
> c(1, 5, 11) %in% (1:10)
# [1] TRUE TRUE FALSE
> setNames(c(1, 2, 3), c("a", "b", "c"))
# a b c
# 1 2 3
> order(c(20, 50, 10, 90, 30))
# [1] 3 1 5 2 4
```
]
.column[
```R
> sink("filename.dat") # Output goes to file
> print("Hello World!")
# Nothing in terminal, line appears in file
> sink() # Closes last sink
> pdf("file.pdf", width = 7, height = 5)
> plot(1:5, 5:1) # Plot goes into pdf file
> dev.off() # Closes current device !important!
> tryCatch(stop("Sample error"),
+ error = function(e) print("Err handled"),
+ finally = print("Cleanup"))
# [1] "Cleanup"
# [1] "Err handled"
```
]
]
---
class: utu-back-title, title-slide
# Thank you!
</textarea>
<script src="https://rawgit.com/csc-training/slide-template/master/remark/src/remark-0.13.0-min.js">
</script>
<script type="text/javascript">
remark.macros.scale = function (percentage) {
var url = this;
return '<img src="' + url + '" style="width: ' + percentage + '" />';
};
remark.macros.size = function (x,y) {
var url = this;
return '<img src="' + url + '" style="width: ' + x + 'px; height: ' + y + 'px" />';
};
remark.macros.author = function () {
var url = this;
return '<img src="' + url + '" class=author-pic />';
};
var slideshow = remark.create({
ratio: '16:9',
slideNumberFormat: '%current% / %total%',
highlightStyle: 'default',
highlightLines: true,
countIncrementalSlides: false
}) ;
</script>
<!-- for offline mathjax see http://stackoverflow.com/a/19209462 -->
<script src="https://cdnjs.cloudflare.com/ajax/libs/mathjax/2.7.1/MathJax.js?config=TeX-AMS_HTML&delayStartupUntil=configured" type="text/javascript">
</script>
<script type="text/javascript">
MathJax.Hub.Config({
tex2jax: {
skipTags: ['script', 'noscript', 'style', 'textarea', 'pre'],
inlineMath: [['$','$'], ['\\(','\\)']],
processEscapes: true
},
"TeX": {
Macros: {AA : "{\\unicode{x212B}}"},
extensions: ["autoload-all.js"]
},
"HTML-CSS": {
scale: 90
}
});
MathJax.Hub.Queue(function() {
$(MathJax.Hub.getAllJax()).map(function(index, elem) {
return(elem.SourceElement());
}).parent().addClass('has-jax');
});
MathJax.Hub.Register.StartupHook("TeX autoload-all Ready", function () {
var MACROS = MathJax.InputJax.TeX.Definitions.macros;
MACROS.color = "Color";
delete MACROS.colorbox;
delete MACROS.fcolorbox;
});
MathJax.Hub.Configured();
</script>
</body>
</html>