A small module that simplifies the processing of Auth0 logs.
The amount of days logs are available depends on your Auth0 plan.
npm install auth0-logs-processorIf you want to count how many logs you have
var processor = require('auth0-logs-processor').create({
    domain: 'MY_AUTH0_DOMAIN',
    clientId: 'MY_AUTH0_CLIENT',
    clientSecret: 'MY_AUTH0_SECRET',
});

var count = 0;

processor.each(function(log){
    count++;
});

processor.done(function(){
    console.log(count);
});

processor.start();
Available in the samples folder, monthly signup per app:
var processor = require('auth0-logs-processor').create({
  domain: 'MY_AUTH0_DOMAIN',
  clientId: 'MY_AUTH0_CLIENT',
  clientSecret: 'MY_AUTH0_SECRET',
});

var months = {};

processor.each(function(entry){
  // discard non signup events
  if (entry.type !== 'ss') { return; }

  var date = new Date(entry.date);

  var monthKey = date.getUTCFullYear() + '-' + date.getUTCMonth();

  if (!months[monthKey]){
    months[monthKey] = {};
  }

  if (!months[monthKey][entry.client_id]){
    months[monthKey][entry.client_id] = 0;
  }

  months[monthKey][entry.client_id]++;
});

processor.done(function(){
  Object.keys(months).forEach(function(m){
    console.log('Month:' + m);
    Object.keys(months[m]).forEach(function(c){
      console.log('Client ' + c + ':' + months[m][c]);
    });
  })
});

processor.start();
And the same as above assuming your logs fit into memory (dedicated to @woloski):
var _ = require('lodash');

var processor = require('auth0-logs-processor').create({
  domain: 'MY_AUTH0_DOMAIN',
  clientId: 'MY_AUTH0_CLIENT',
  clientSecret: 'MY_AUTH0_SECRET',
});

var entries = [];

processor.each(function(entry){
  entries.push(entry);
});

processor.done(function(){
  var groups = _.chain(entries)
    .filter(function(e){
      return e.type === 'ss'
    })
    .groupBy(function(e){
      var date = new Date(e.date);

      return date.getUTCFullYear() + '-' + date.getUTCMonth() + ' ' + e.client_id;
    })
    .value();

  _.forOwn(groups, function(value, key) {
    console.log(key + ': ' + value.length);
  });
});

processor.start();
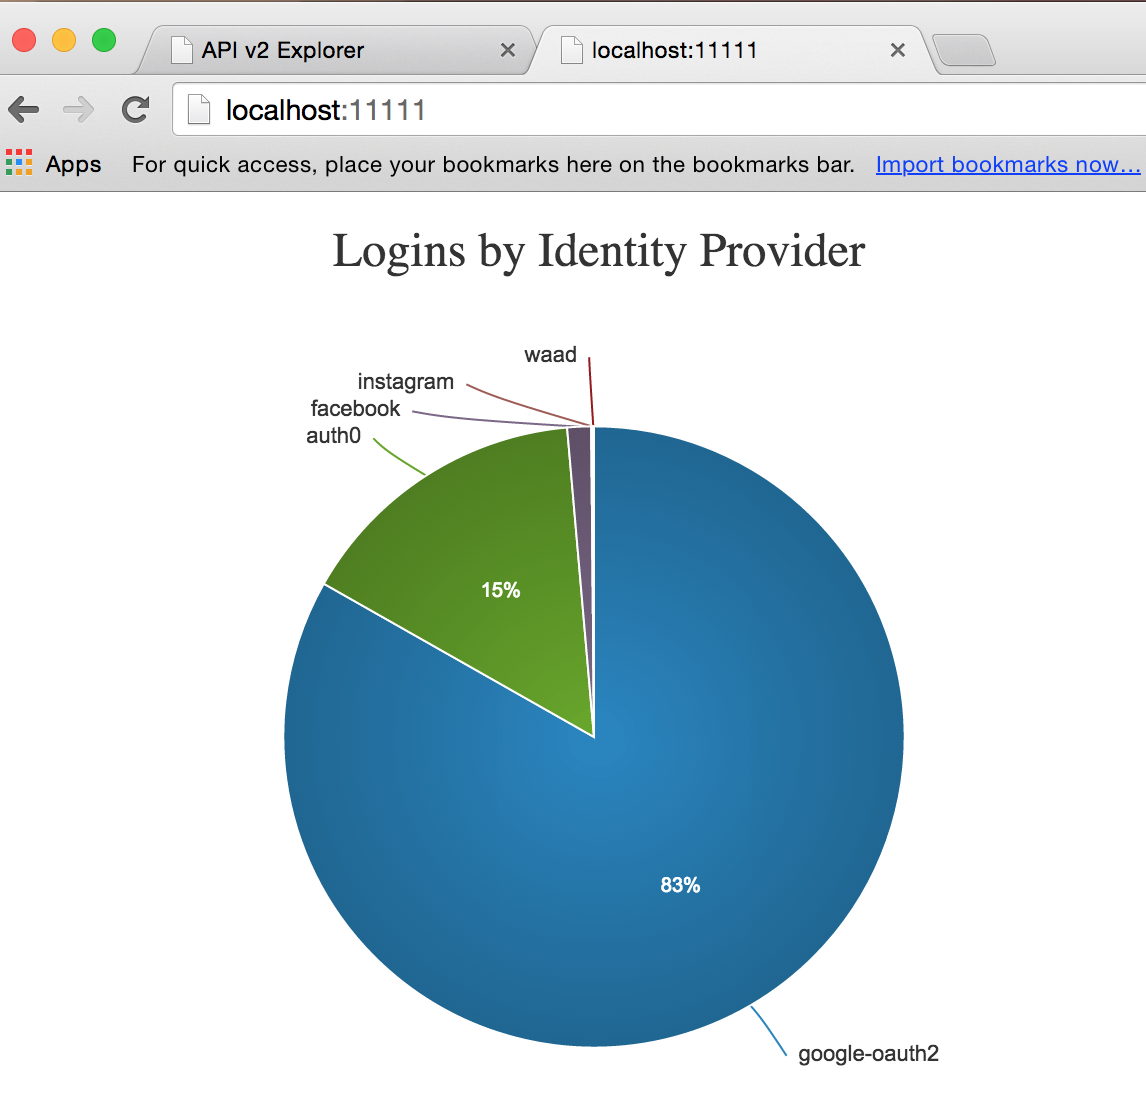
Charts are cool, and you can use the data to create your own 😃.
See samples/charts for a pie chart displaying logins per identity provider. It looks like this:
Shoutout to d3pie.
Put some of these together and create custom dashboards 🎆 💥 ⚡.
Feel free to add new samples by sending PRs.
