Ac6 Zephyr Workbench for VS Code extension adds support of Zephyr development to Visual Studio Code, including SDK management, Project wizard, build and debugging features.
- Install native Host Tools (python, cmake, ...)
- Install and auto-detect default Zephyr SDK
- Import West workspaces from remote repository using west or from local folder
- Parse west workspace data from config file
- Create application projects for specific board from sample
- Build/Flash application
- Debug application (using OpenOCD, LinkServer, J-Link or pyOCD)
- Memory analysis
- Supported on every platforms
Find the complete documentation on: https://zephyr-workbench.com/
To build your project on Zephyr Workbench, No external tools is required. Host tools are installed by the extension itself. To flash and to debug the application on your target, external tools are required. Depending on needs, your might have to install some of the following software tools on your workstation:
- LinkServer Debug Host Tools
- J-Link Debug Host Tools
Additionally a driver software might be required to connect to your JTAG probe.
On MacOSX, due to many dependencies, Homebrew is required to install external tools and python.
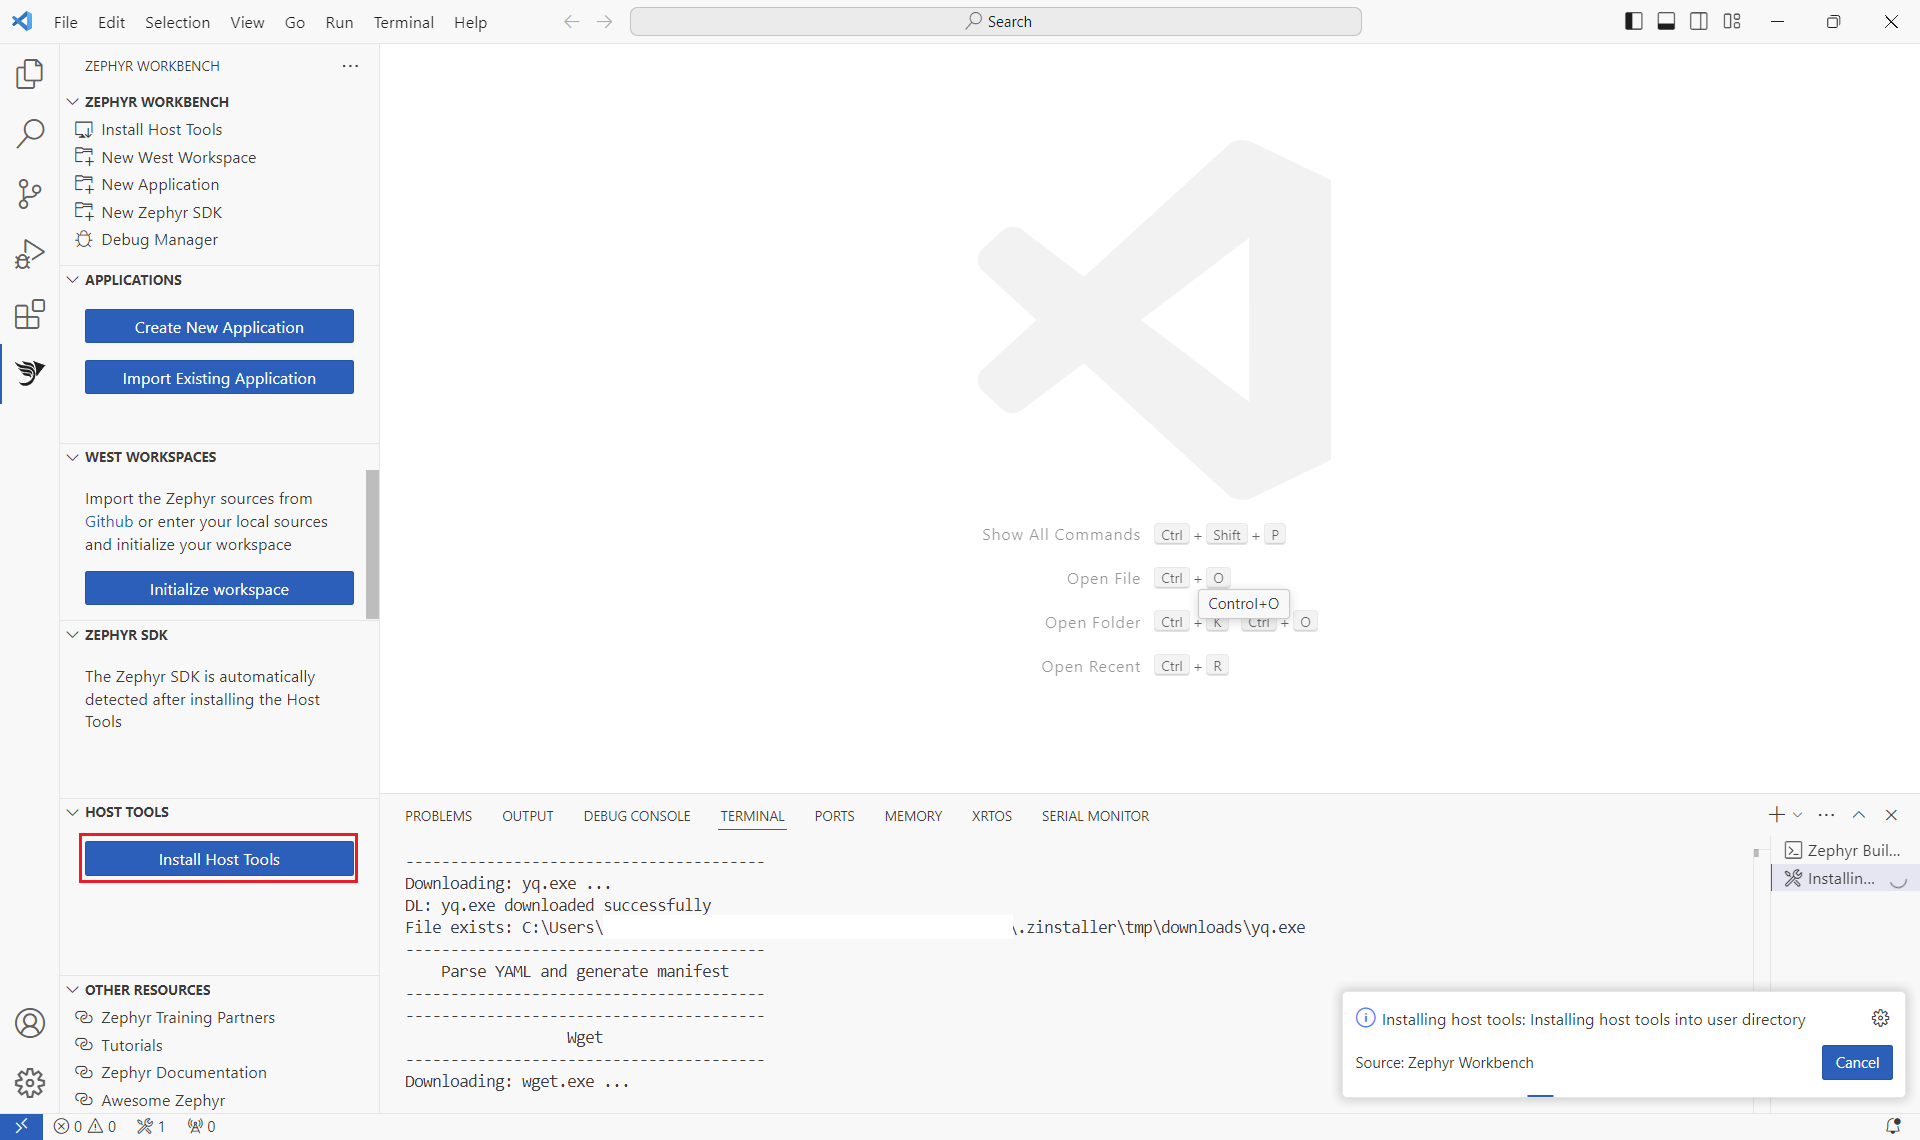
Zephyr Workbench provides a dedicated panel, to access it, click on the "Zephyr Workbench" logo on the left
- Click on "Install Host Tools" to download and to install the native tools in ${USERDIR}/.zinstaller (takes ~5mins)
Note: Some tools needs administration right to be installed on your system.
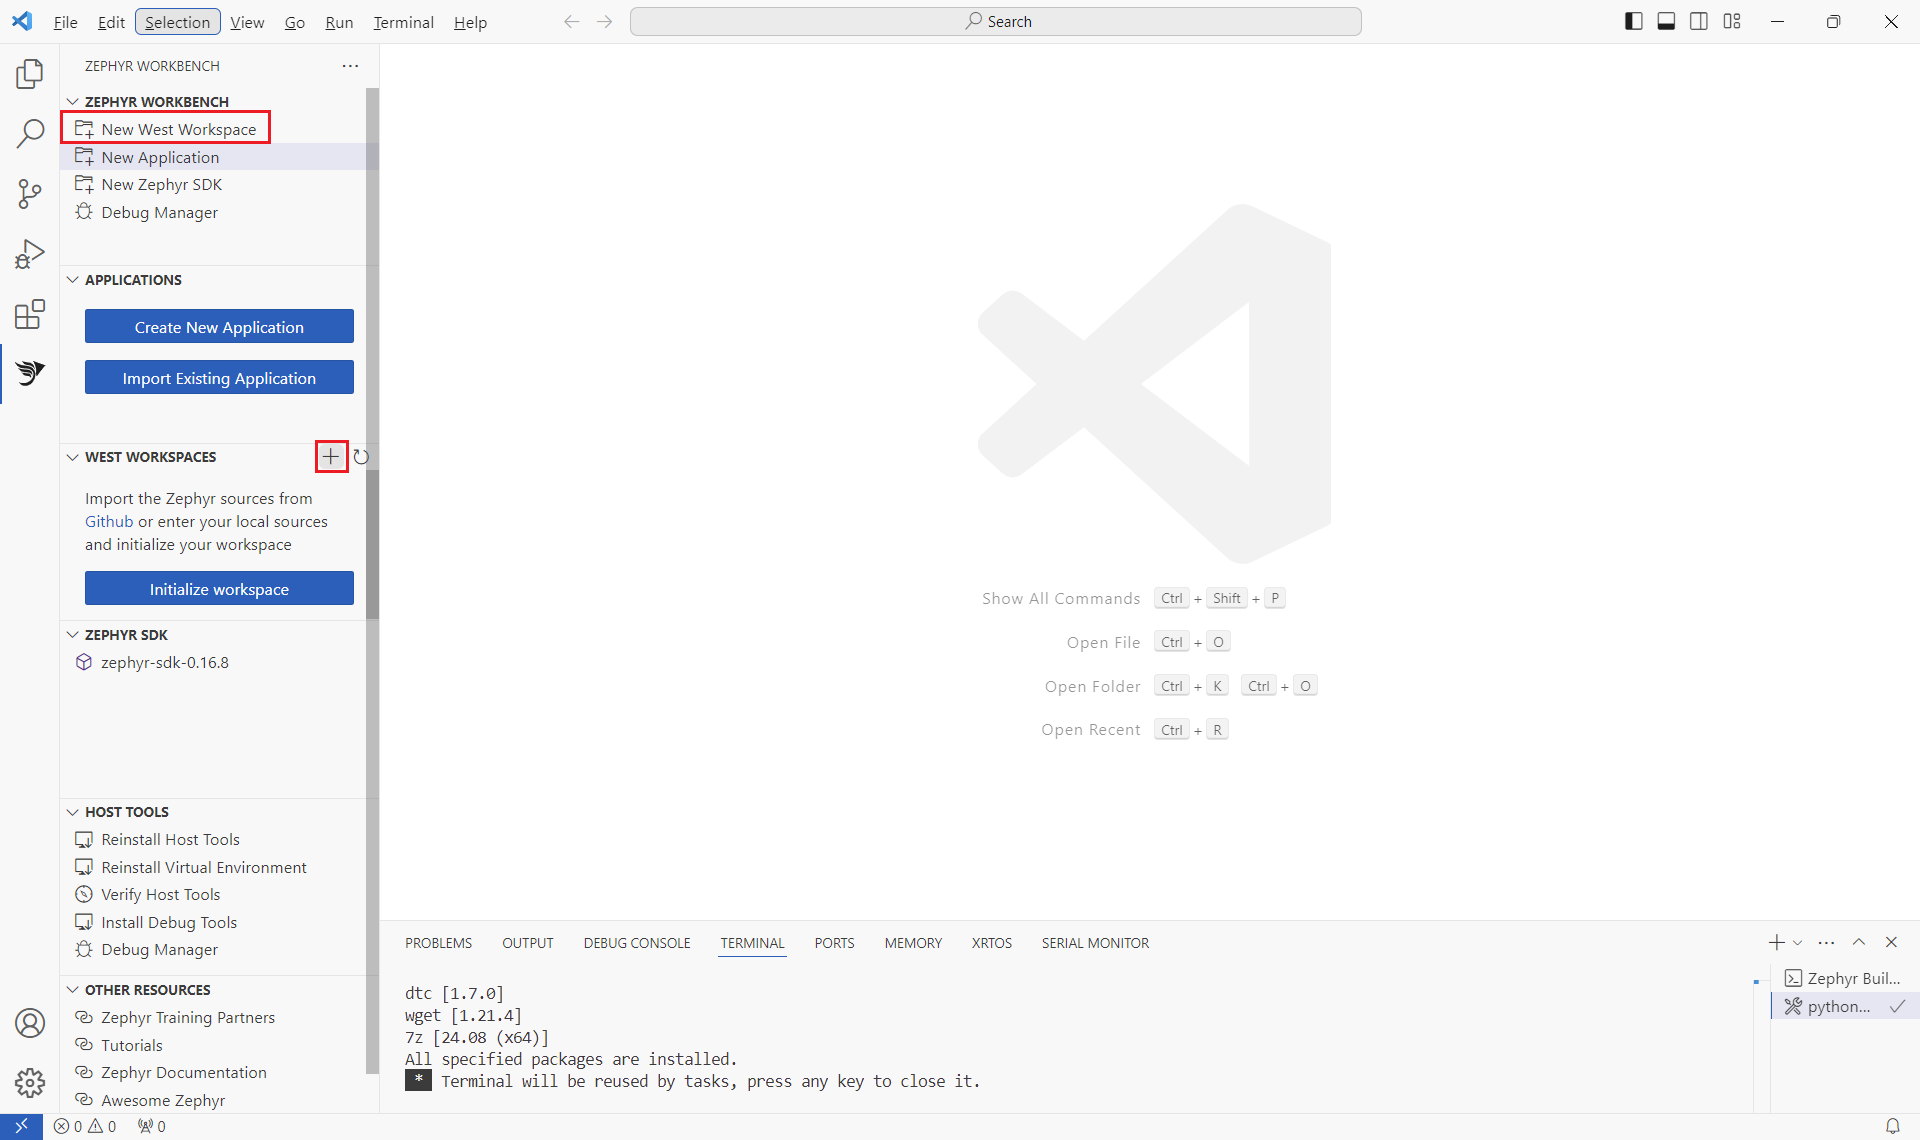
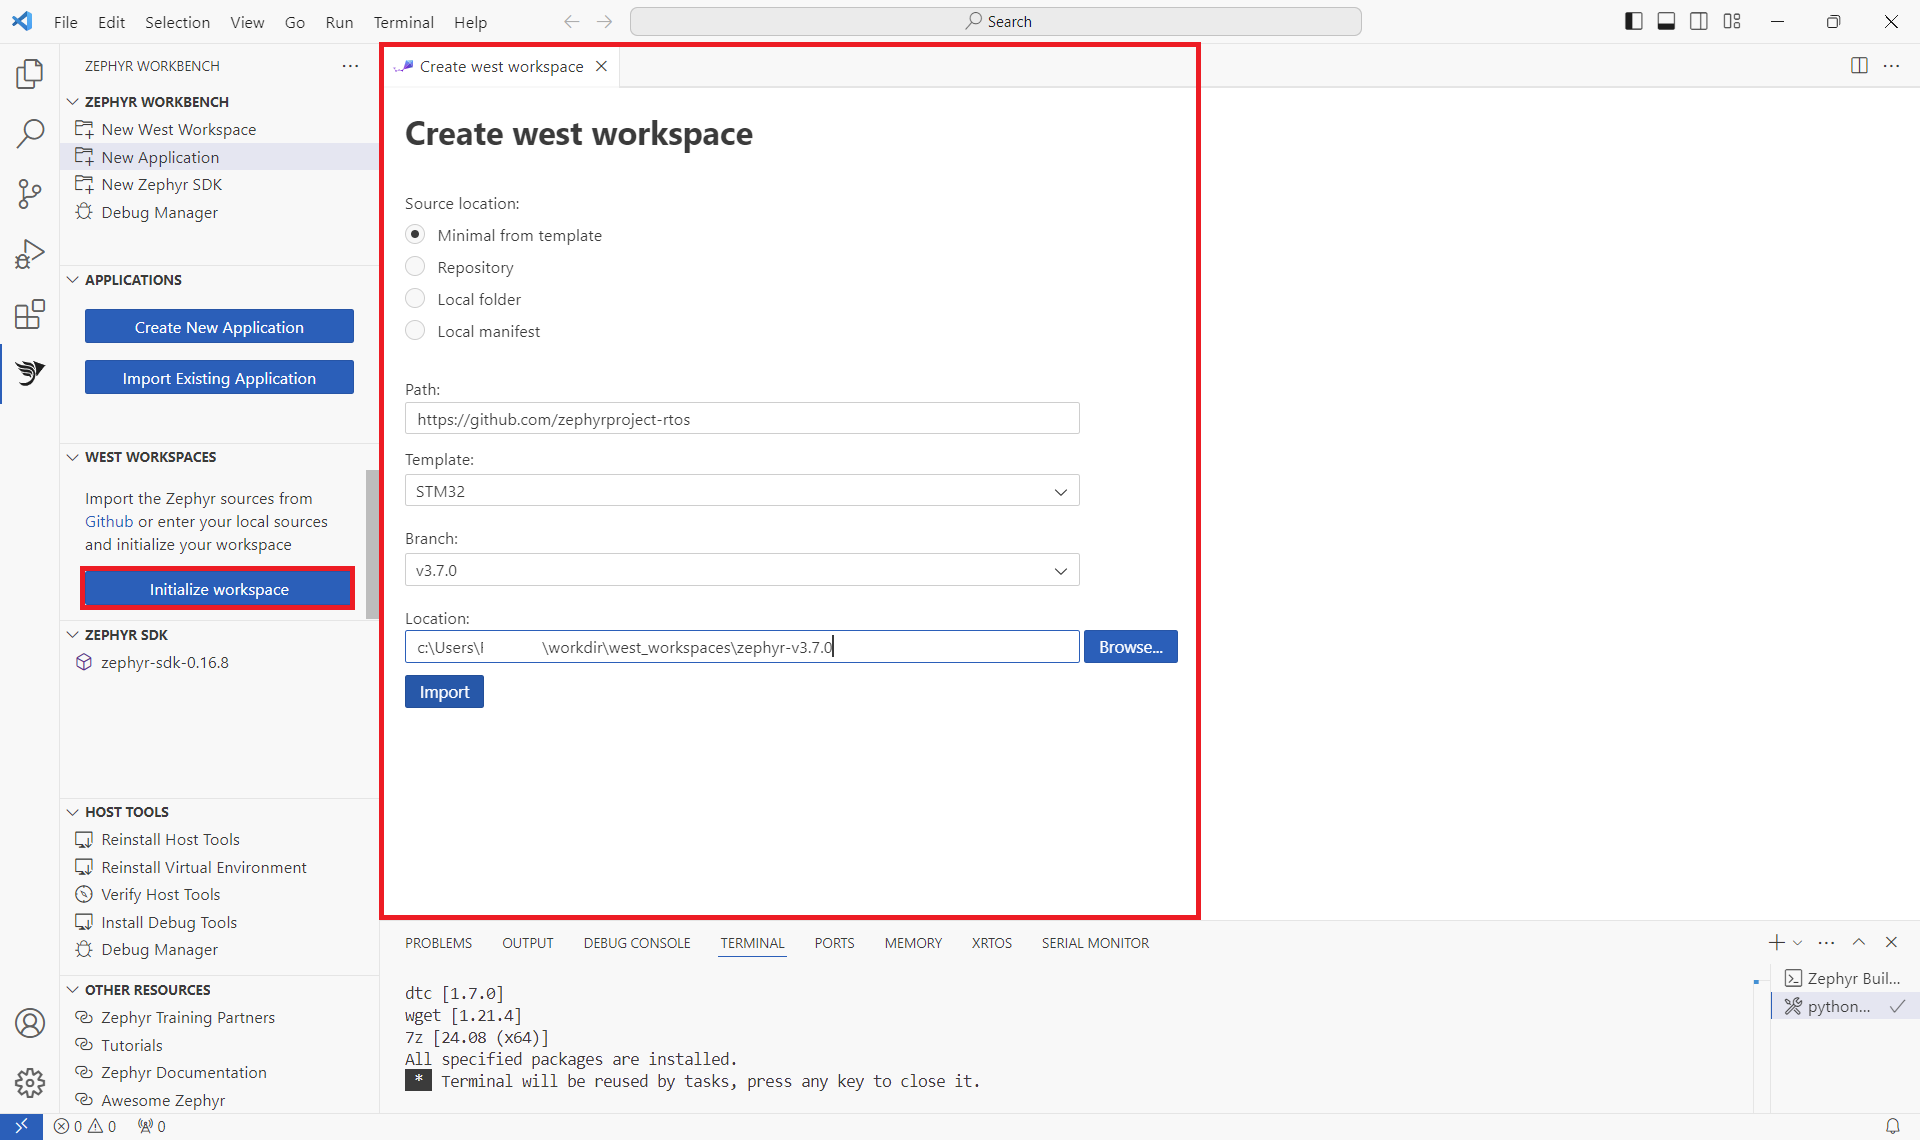
- Click on "Initialize workspace" button
- Open the newly opened page, enter information about your west workspace instance.
- For example: Source location: Minimal from template Path: https://github.com/zephyrproject-rtos/zephyr Template: STM32 Branch: v3.7.0 Location: enter the directory where the west workspace will be imported (the directory name will serve as workspace name) (takes ~10mins to init then update the workspace)
- Click on "Import"
This process creates then parse the west manifest file to set up your west workspace and the subset of projects. More information about West Workspaces.
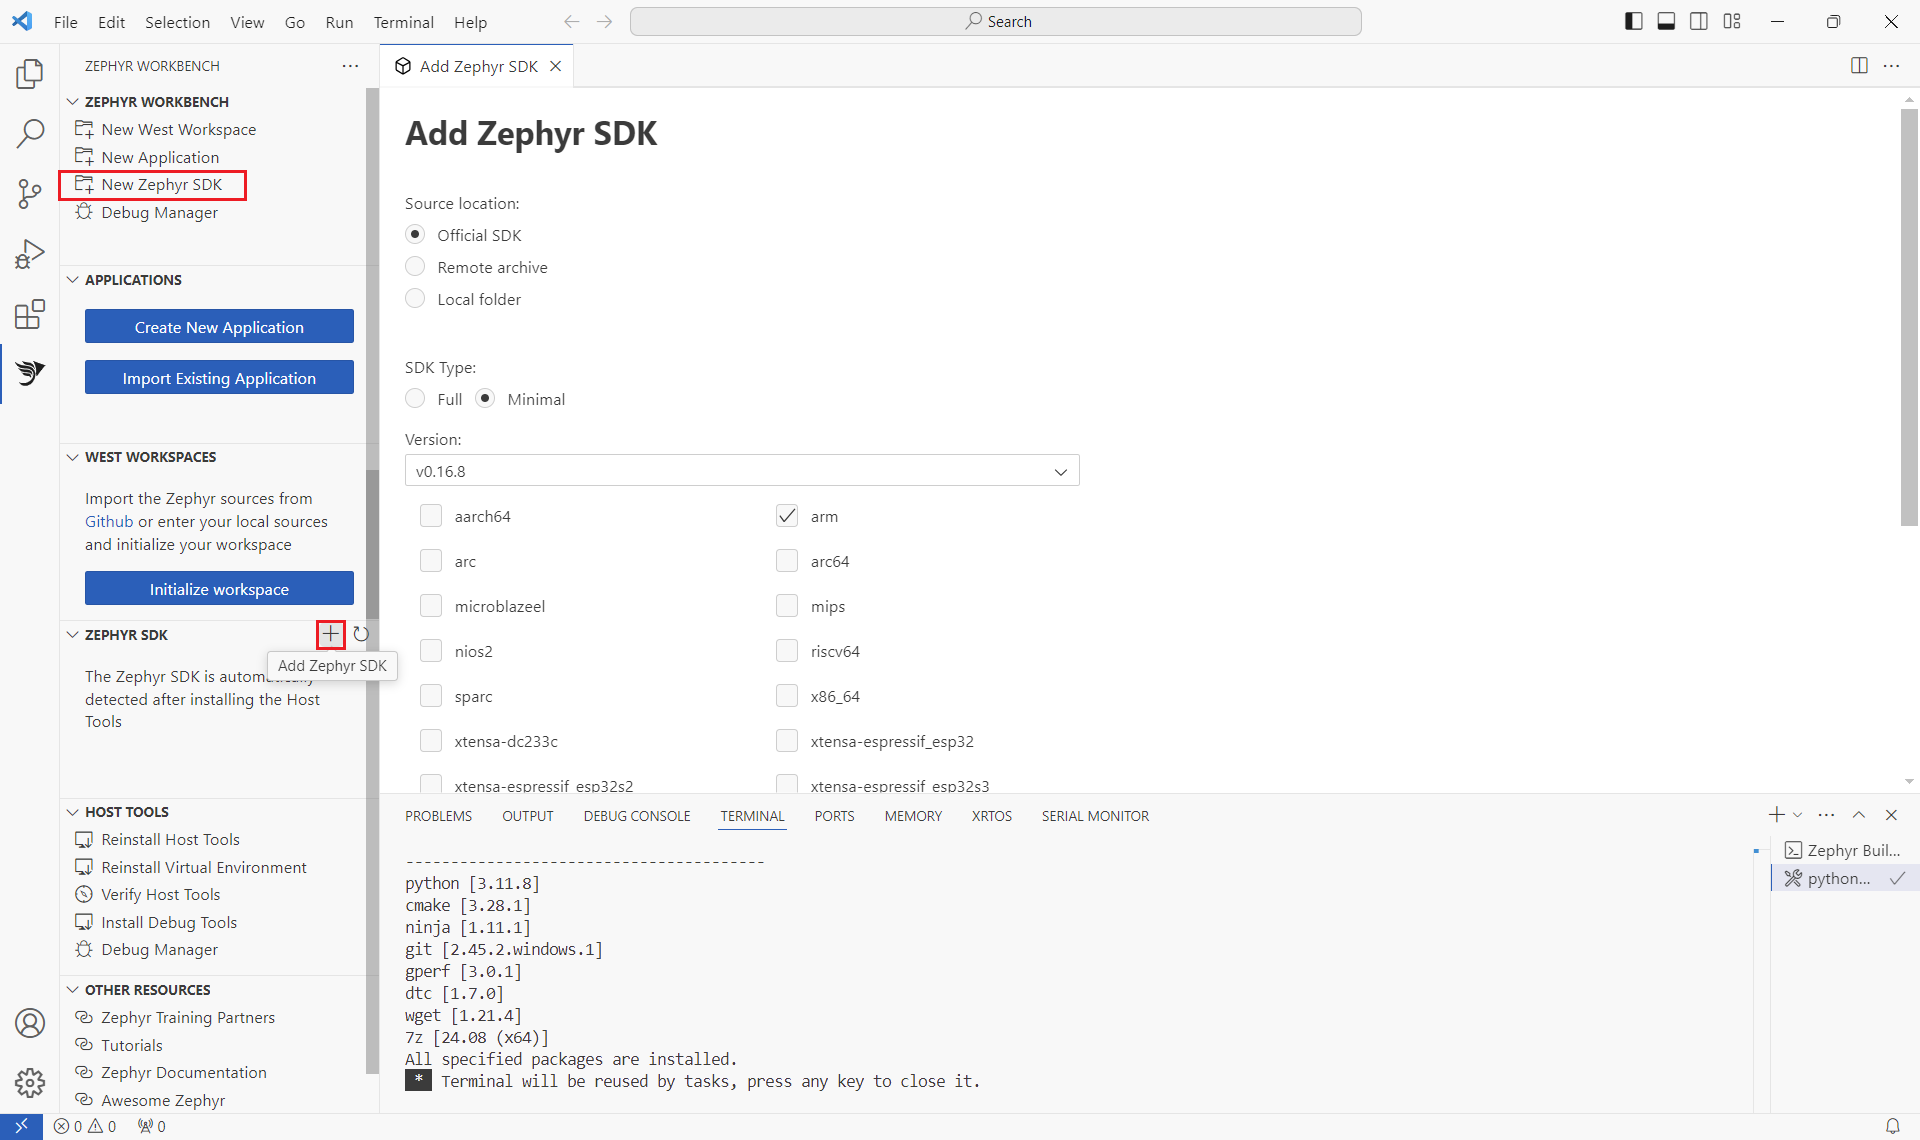
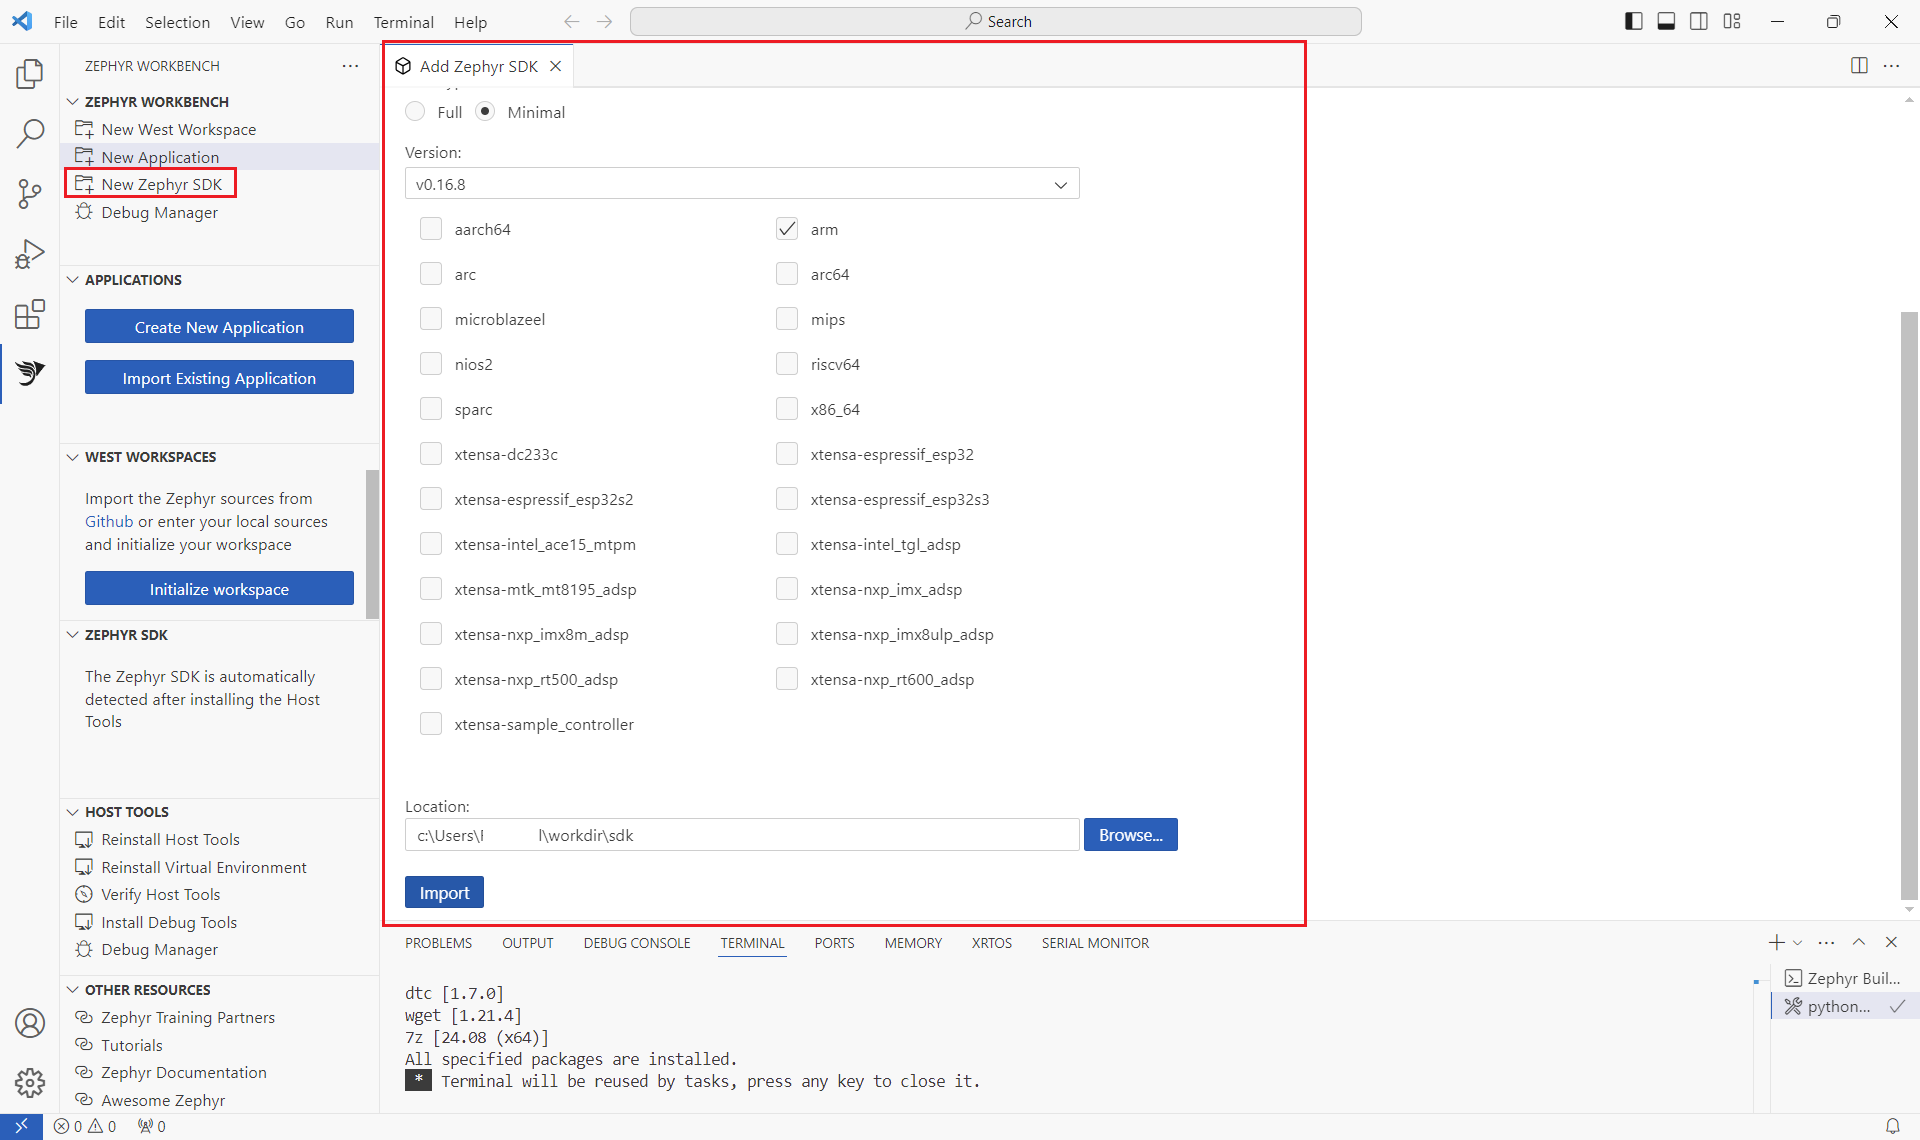
- Click on "Import SDK" button
- Open the newly opened page, enter information about your Zephyr SDK.
- For example: Source location: Official SDK SDK Type: Minimal Version: v0.16.8 Toolchains: aarch64 arm Location: enter the parent location where to import the Zephyr SDK
- Click on "Import"
This process imports to toolchains to build and to debug your Zephyr applications. More information about Zephyr SDK.
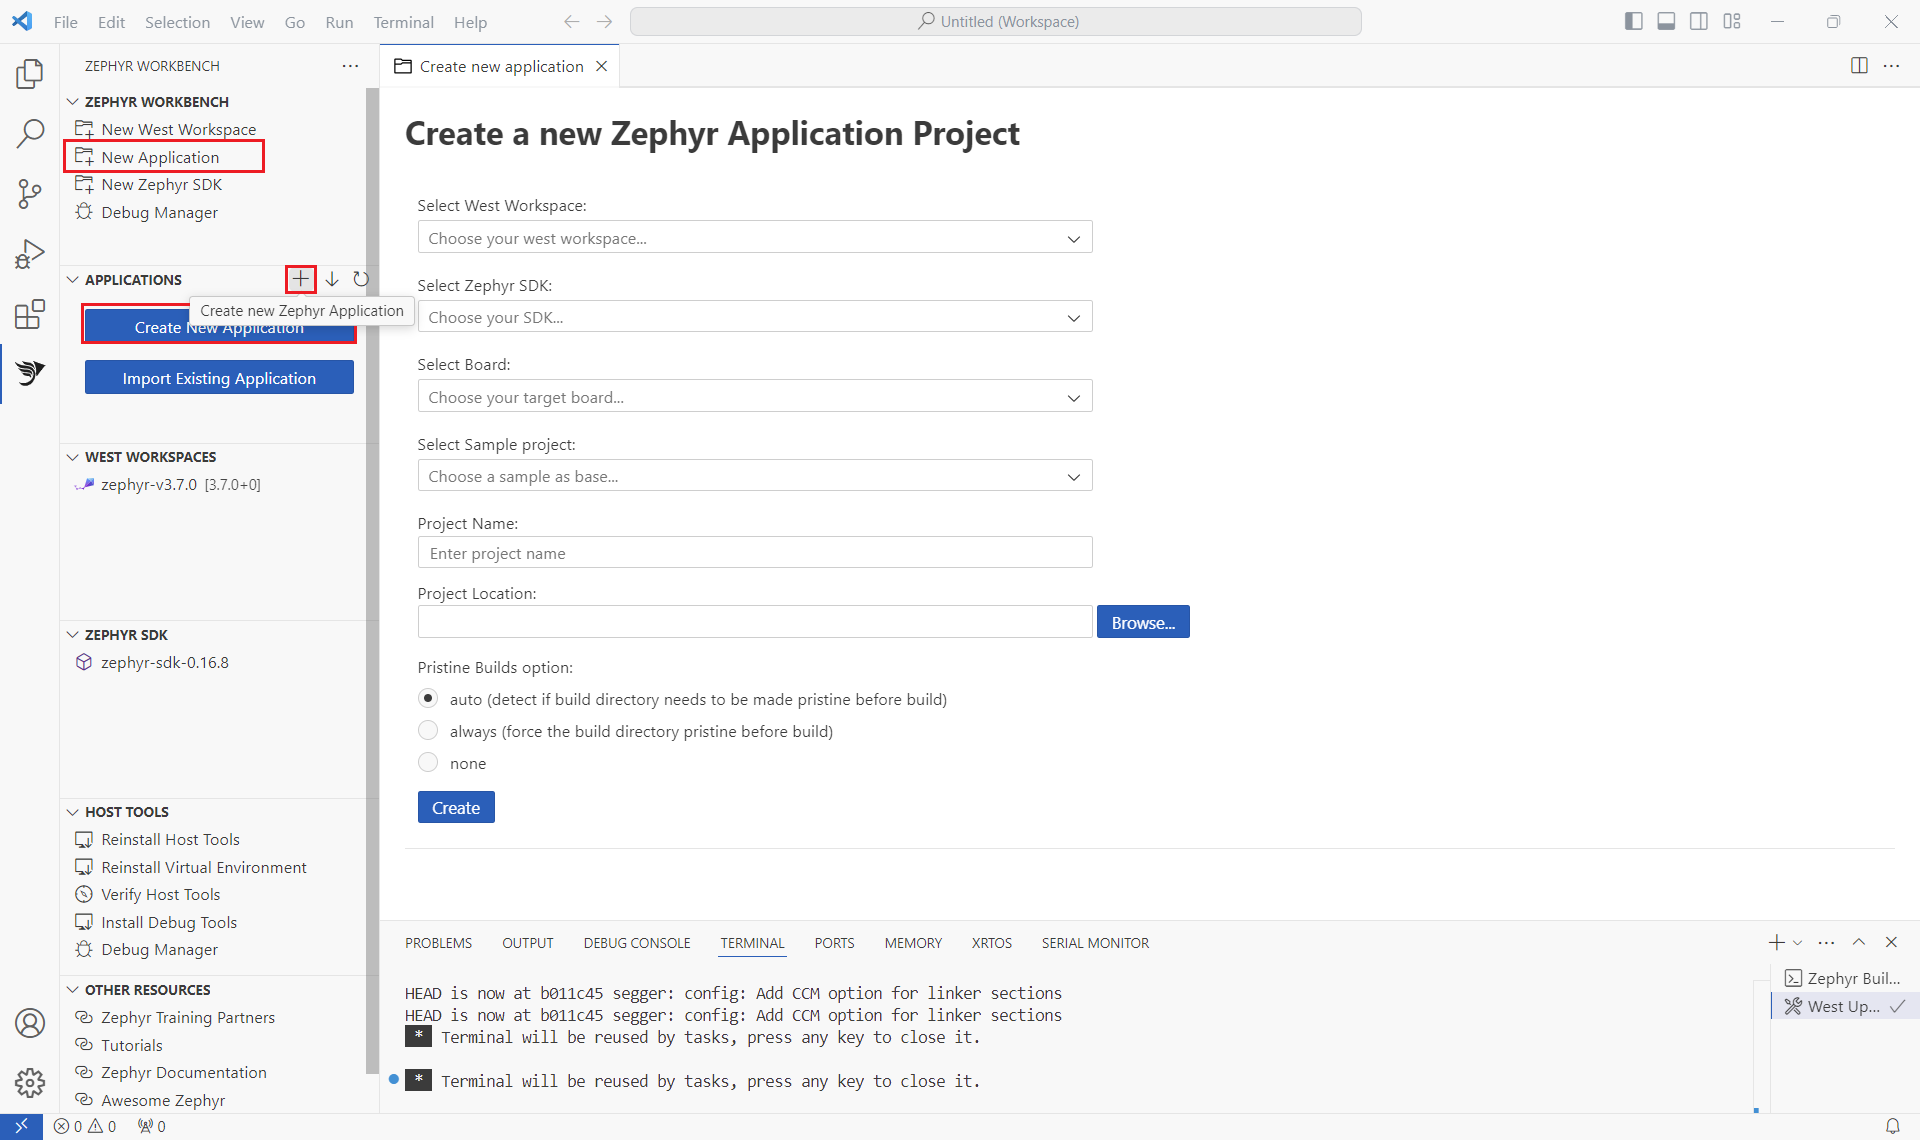
The previous steps ("Import West Workspace" and "Import Zephyr SDK") are mandatory before creating an application.
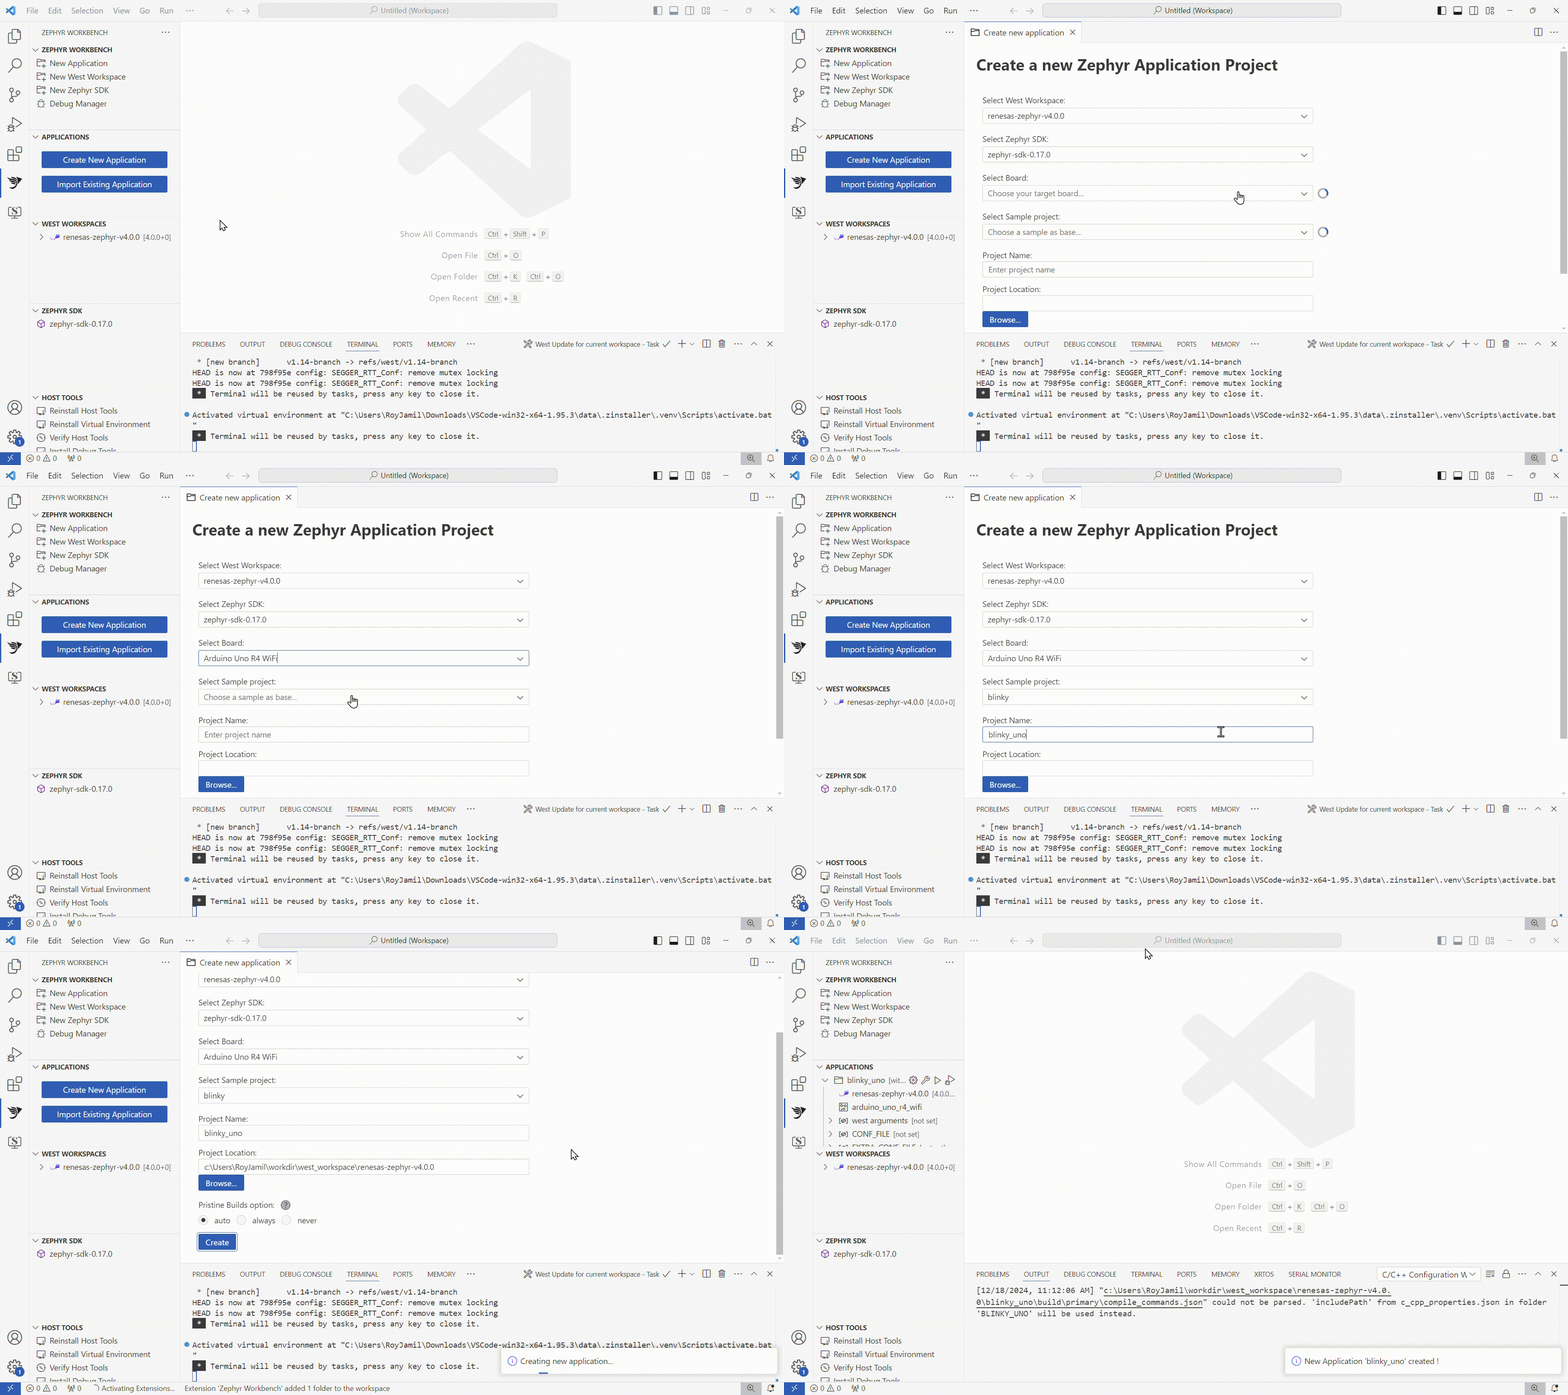
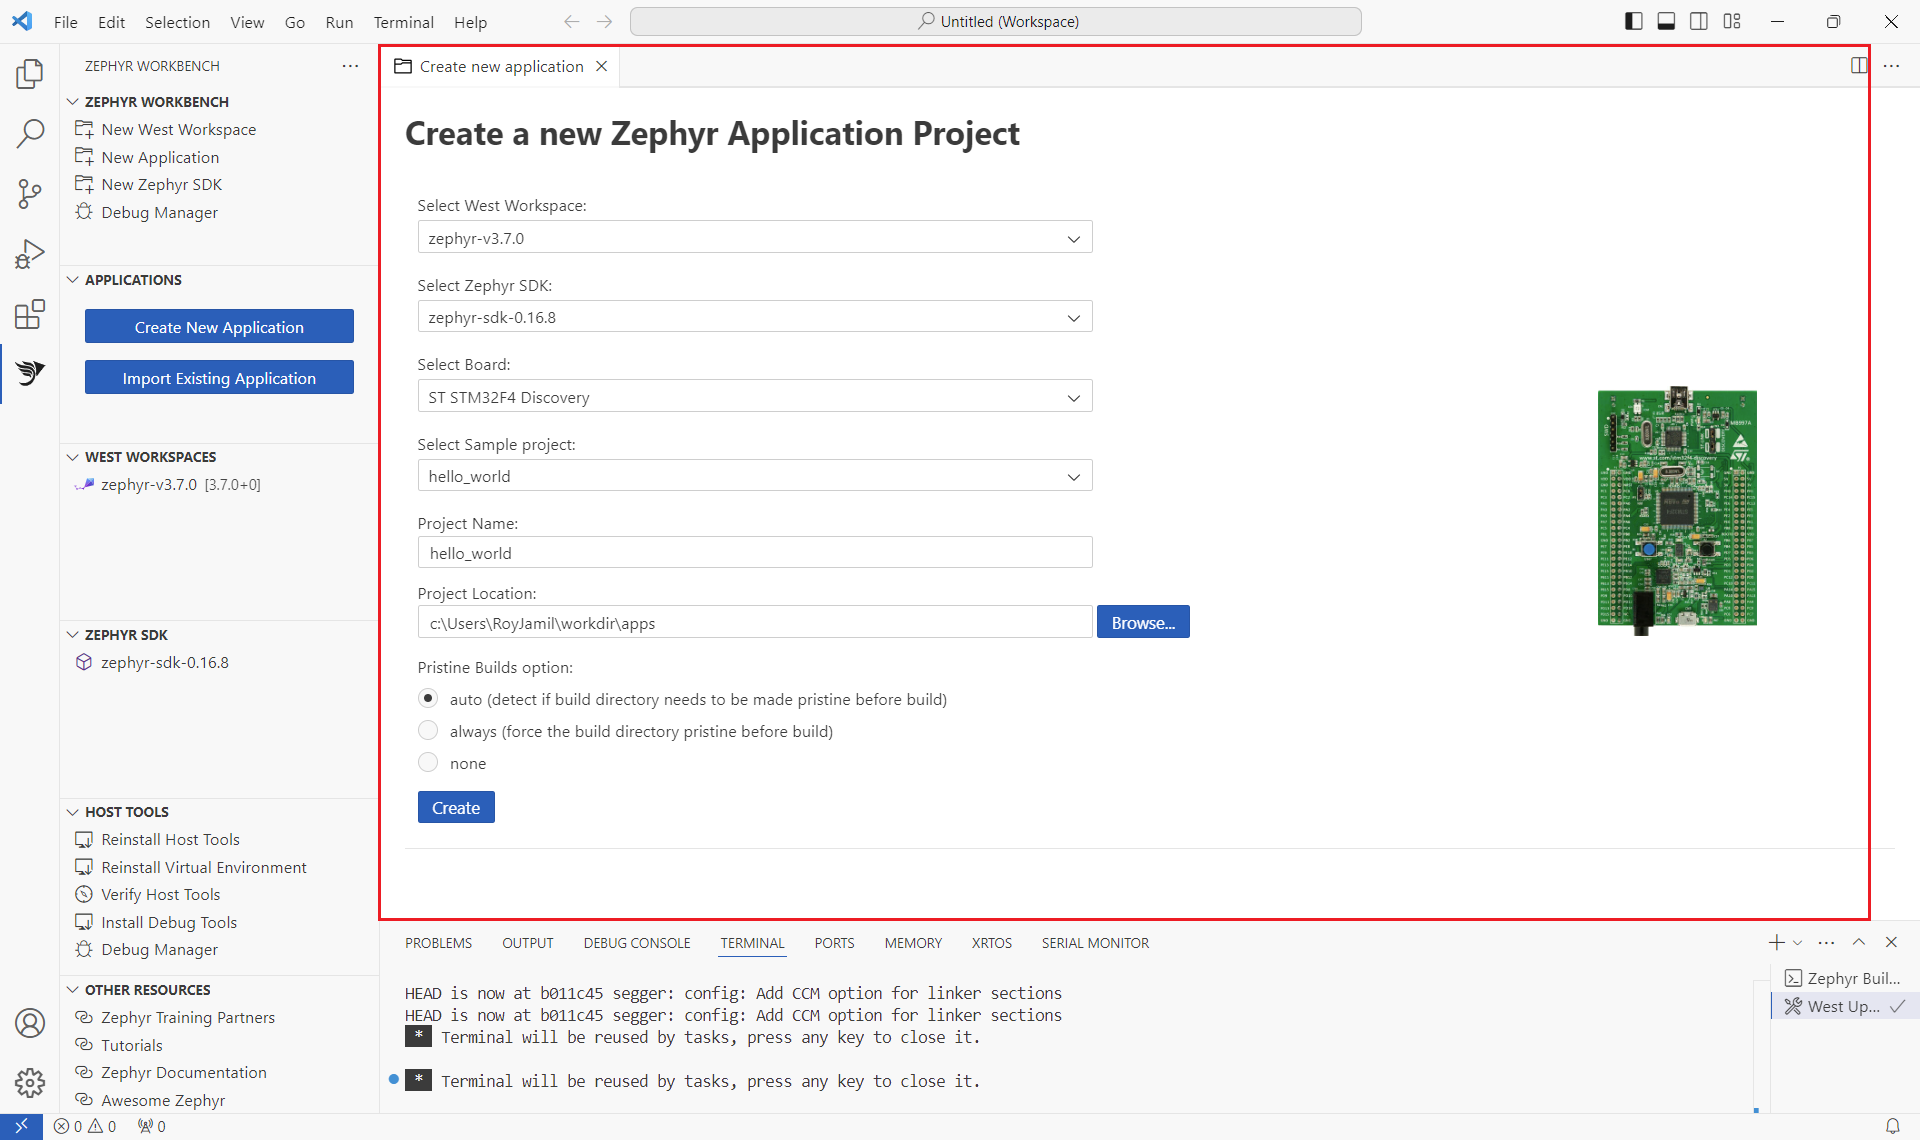
- Click on "Create New Application"
- Select the West Workspace to attach to
- Select the Zephyr SDK to use
- Select the target Board (eg. ST STM32F4 Discovery)
- Select the Sample project as based (eg. blinky)
- Enter the project name
- Enter the project location
- Select the Pristine Build option (More information on Pristine Builds)
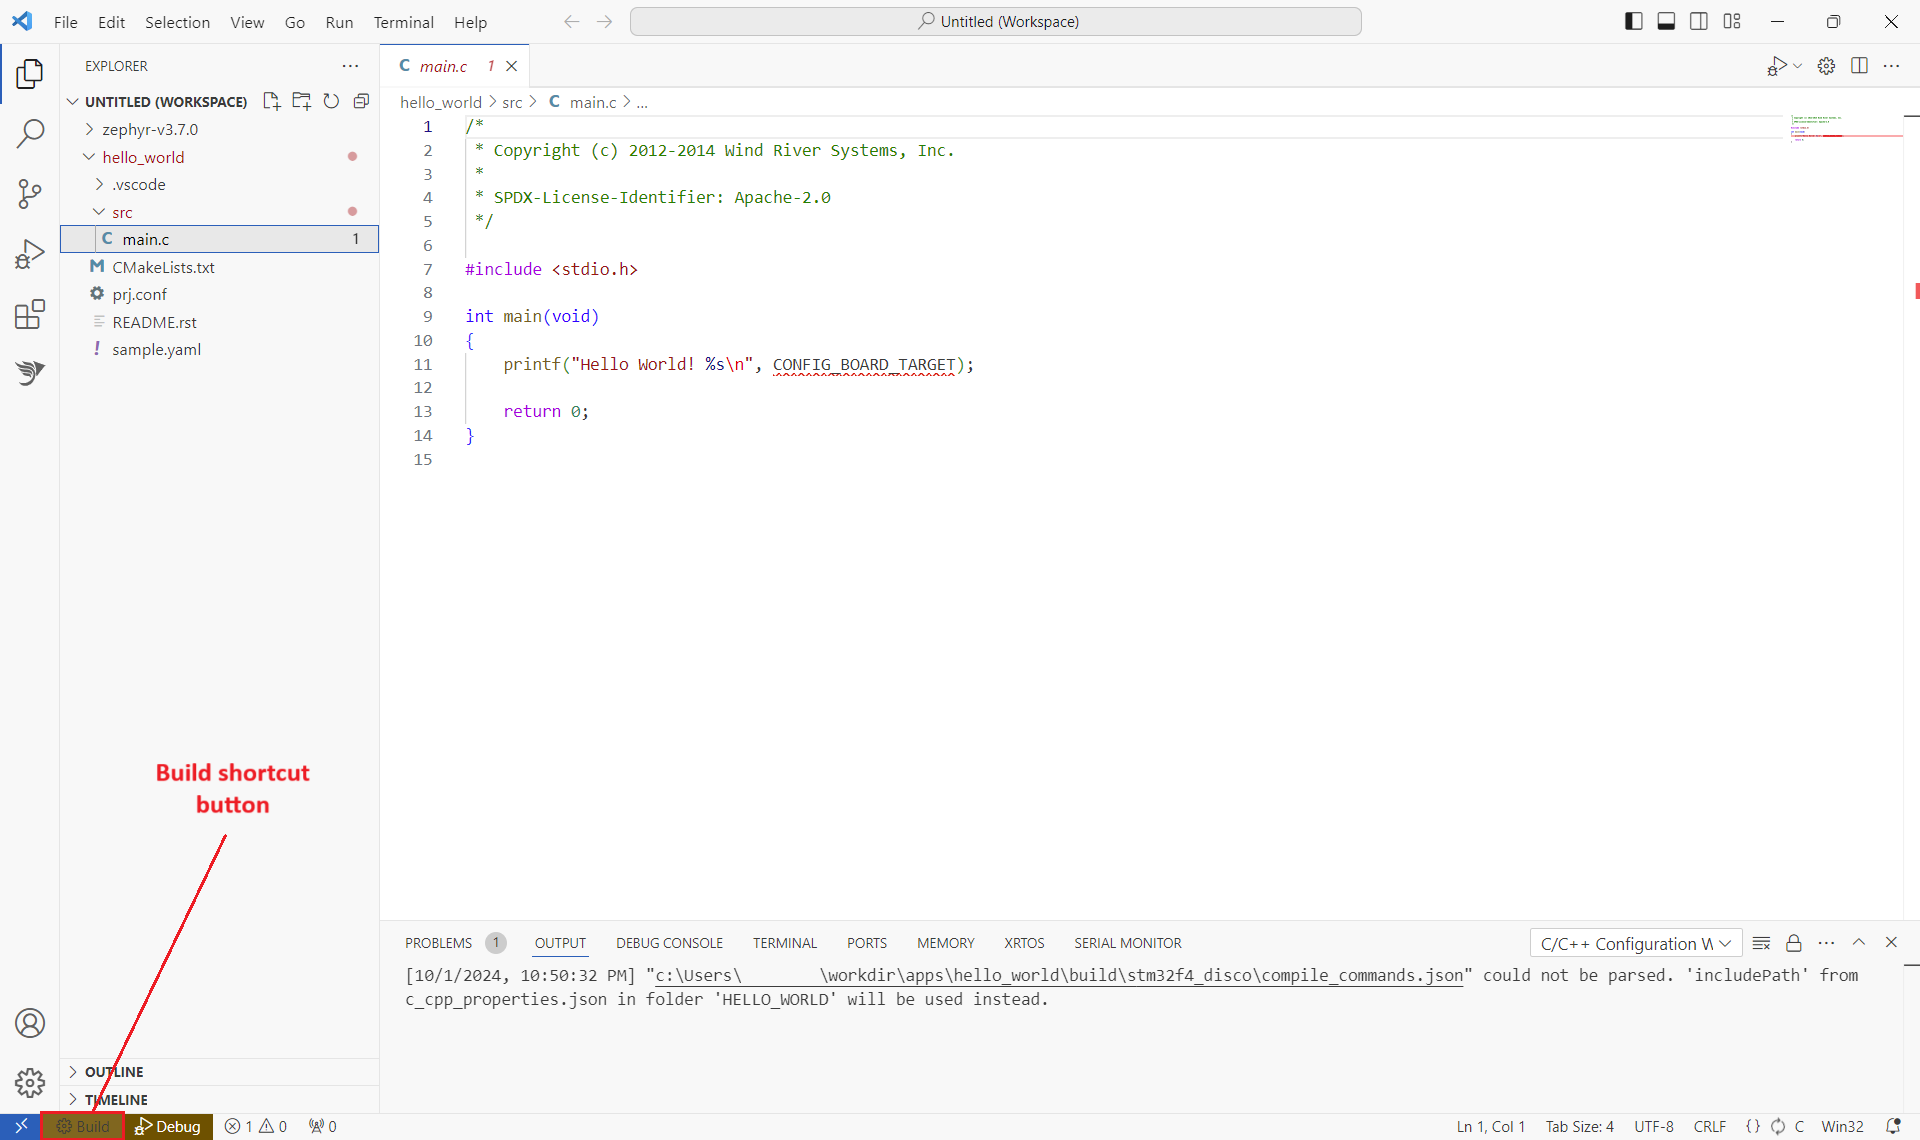
- Click on the "Build" button in the status bar below. Alternatively, Use command key Ctrl+B then select the folder to build.
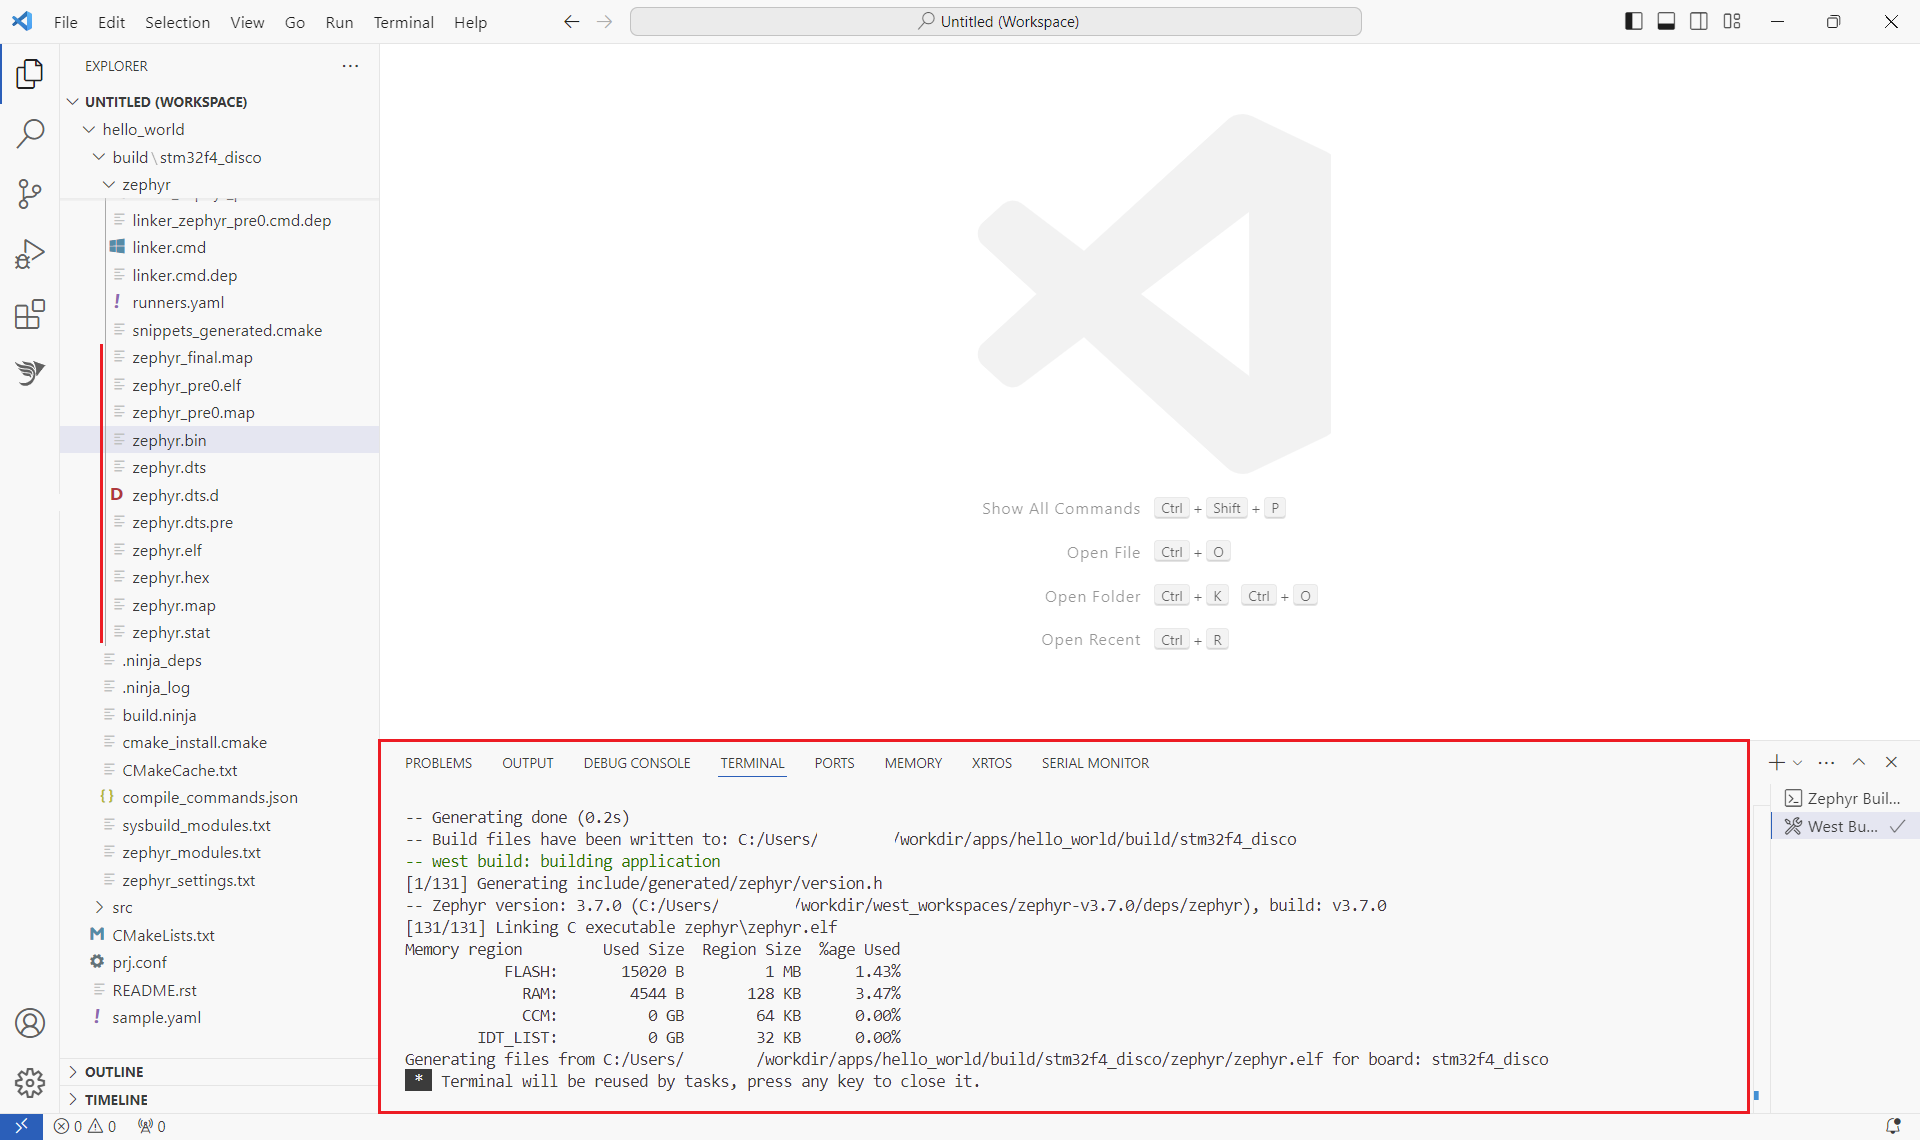
- The build output is display in the Terminal
(Warning) The debug server tool for your board must be installed on your system.
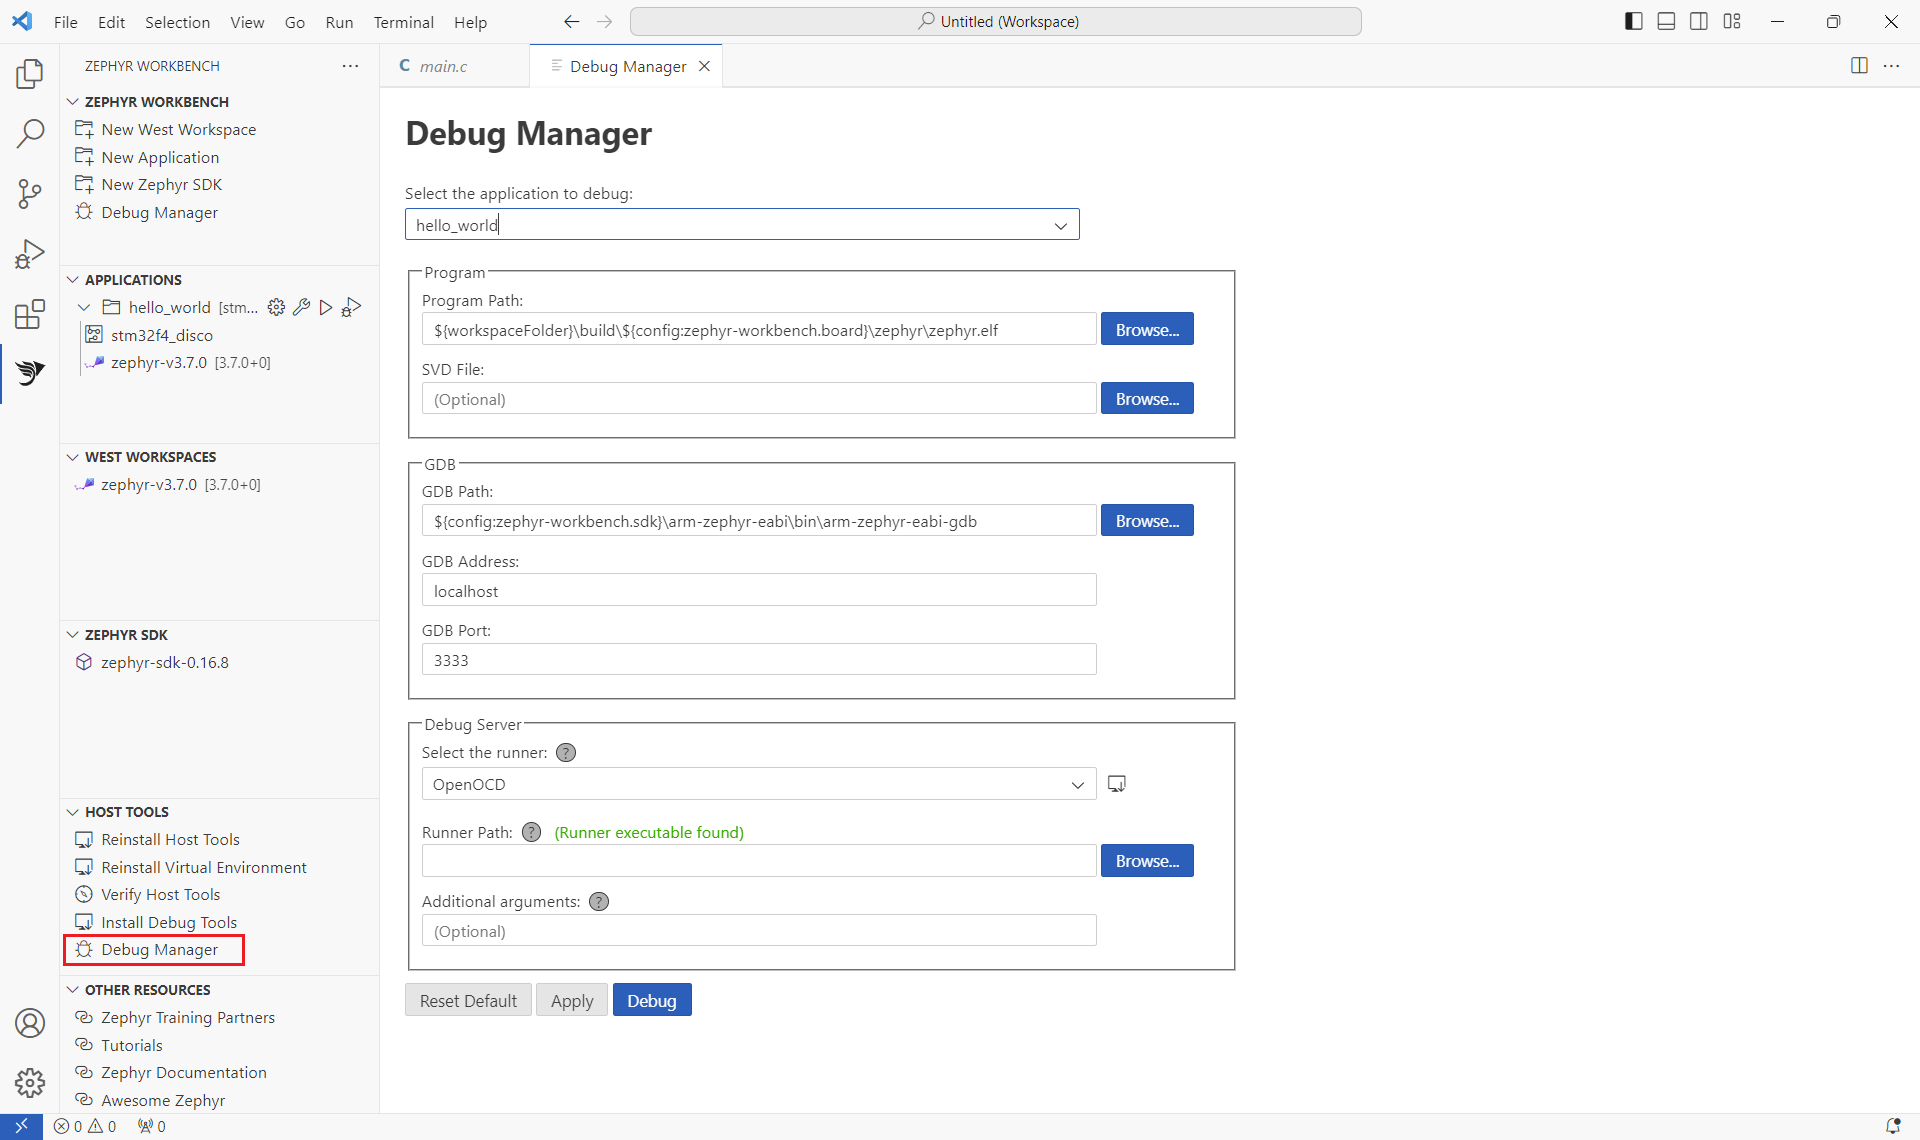
- Click on "Debug Manager" to open a debug configuration form
- Select the application to debug. Some settings are automatically filled.
- If needed, enter another Program Path (the generated ELF image)
- If needed, enter the SVD file for your target
- If needed, enter another GDB debugger
- If needed, enter the address of your target
- If needed, enter the GDB port (useful when running multiple debug session on the same machine)
- Select the debug server (also called runner)
- Enter the path to the debug server binary if not auto-detected
- Additional argument only for advanced user (values can be found in the help of west for each runner)
- Press "Apply" to save the configuration into the .vscode/launch.json or "Debug" to apply then run the debug session
The newly debug configuration is named "Zephyr Workbench Debug"
If the launch configuration was already created, you don't need to open the Debug Manager again. Run your debug session as usually with VSC.
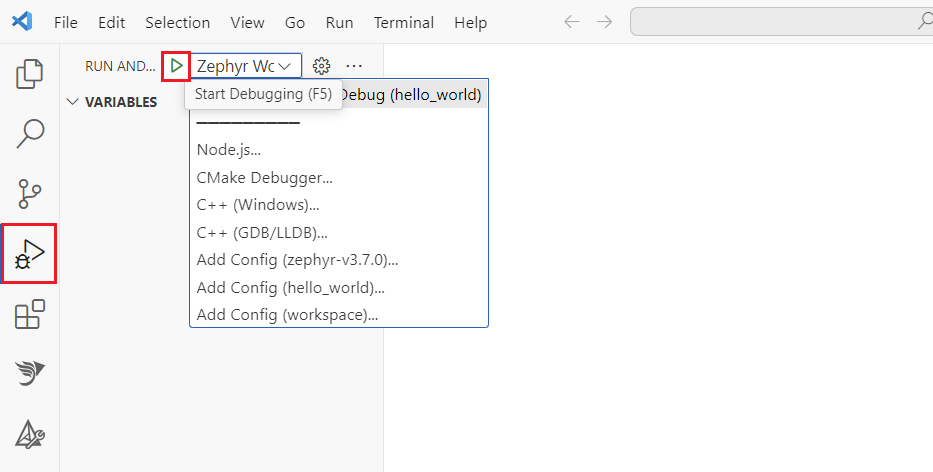
- Go to the "Run and Debug" (Ctrl+Shift+D) activity panel
- Select the launch configuration for your project
- Click on the Run button
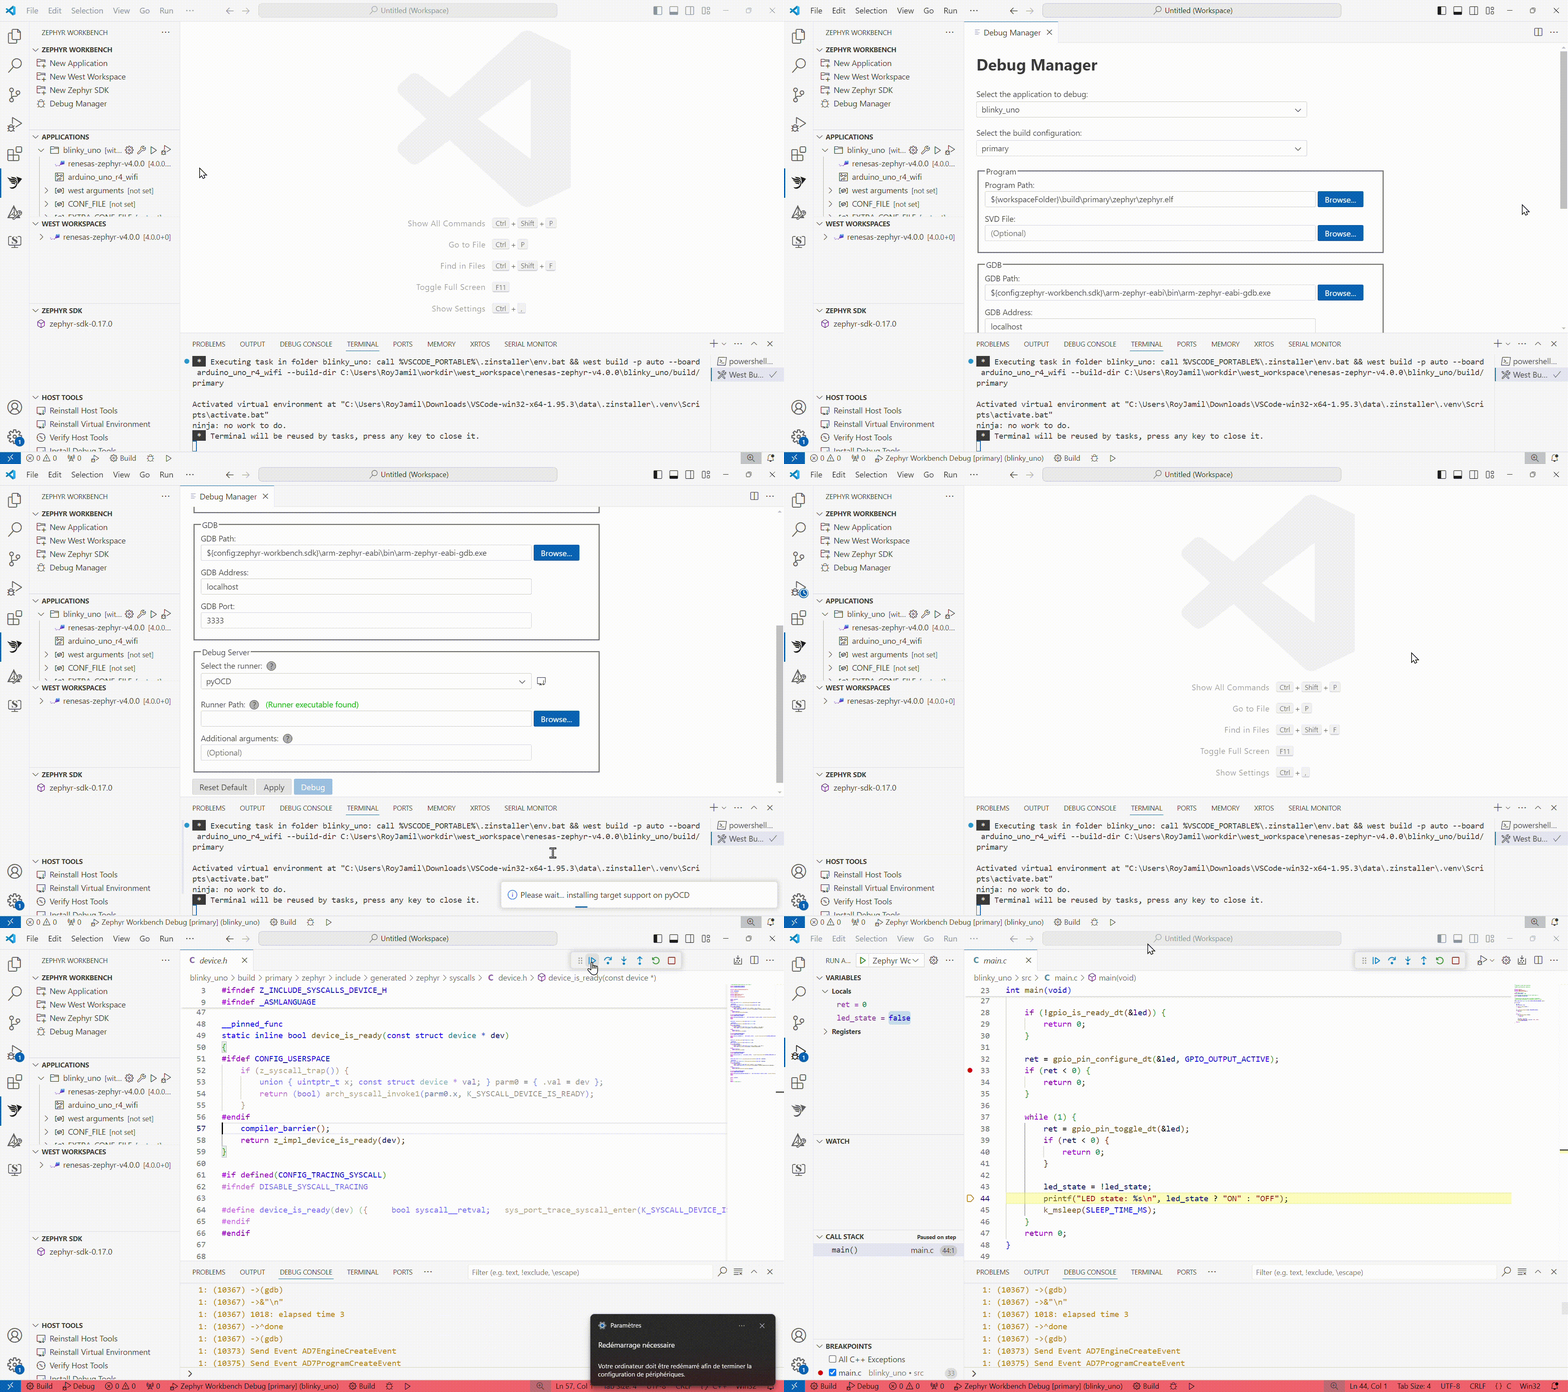
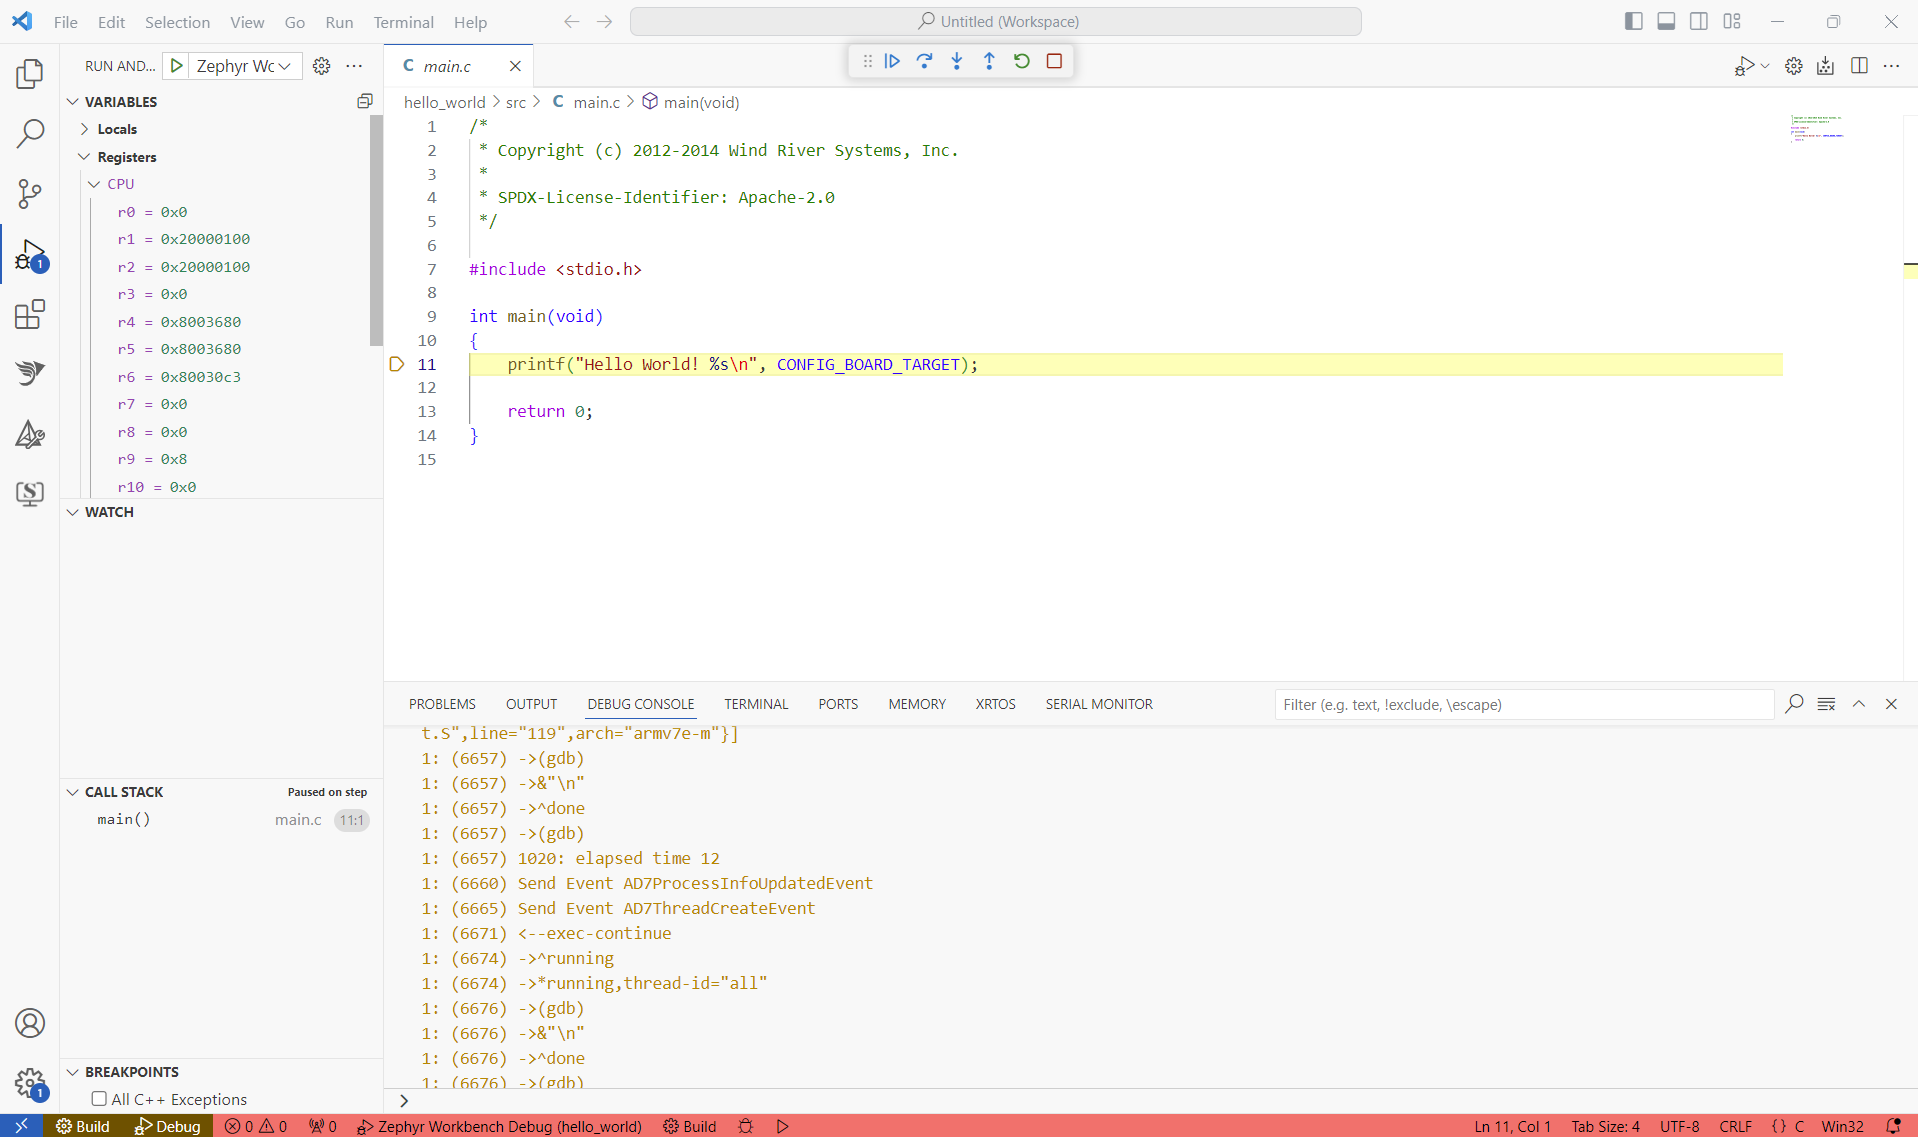
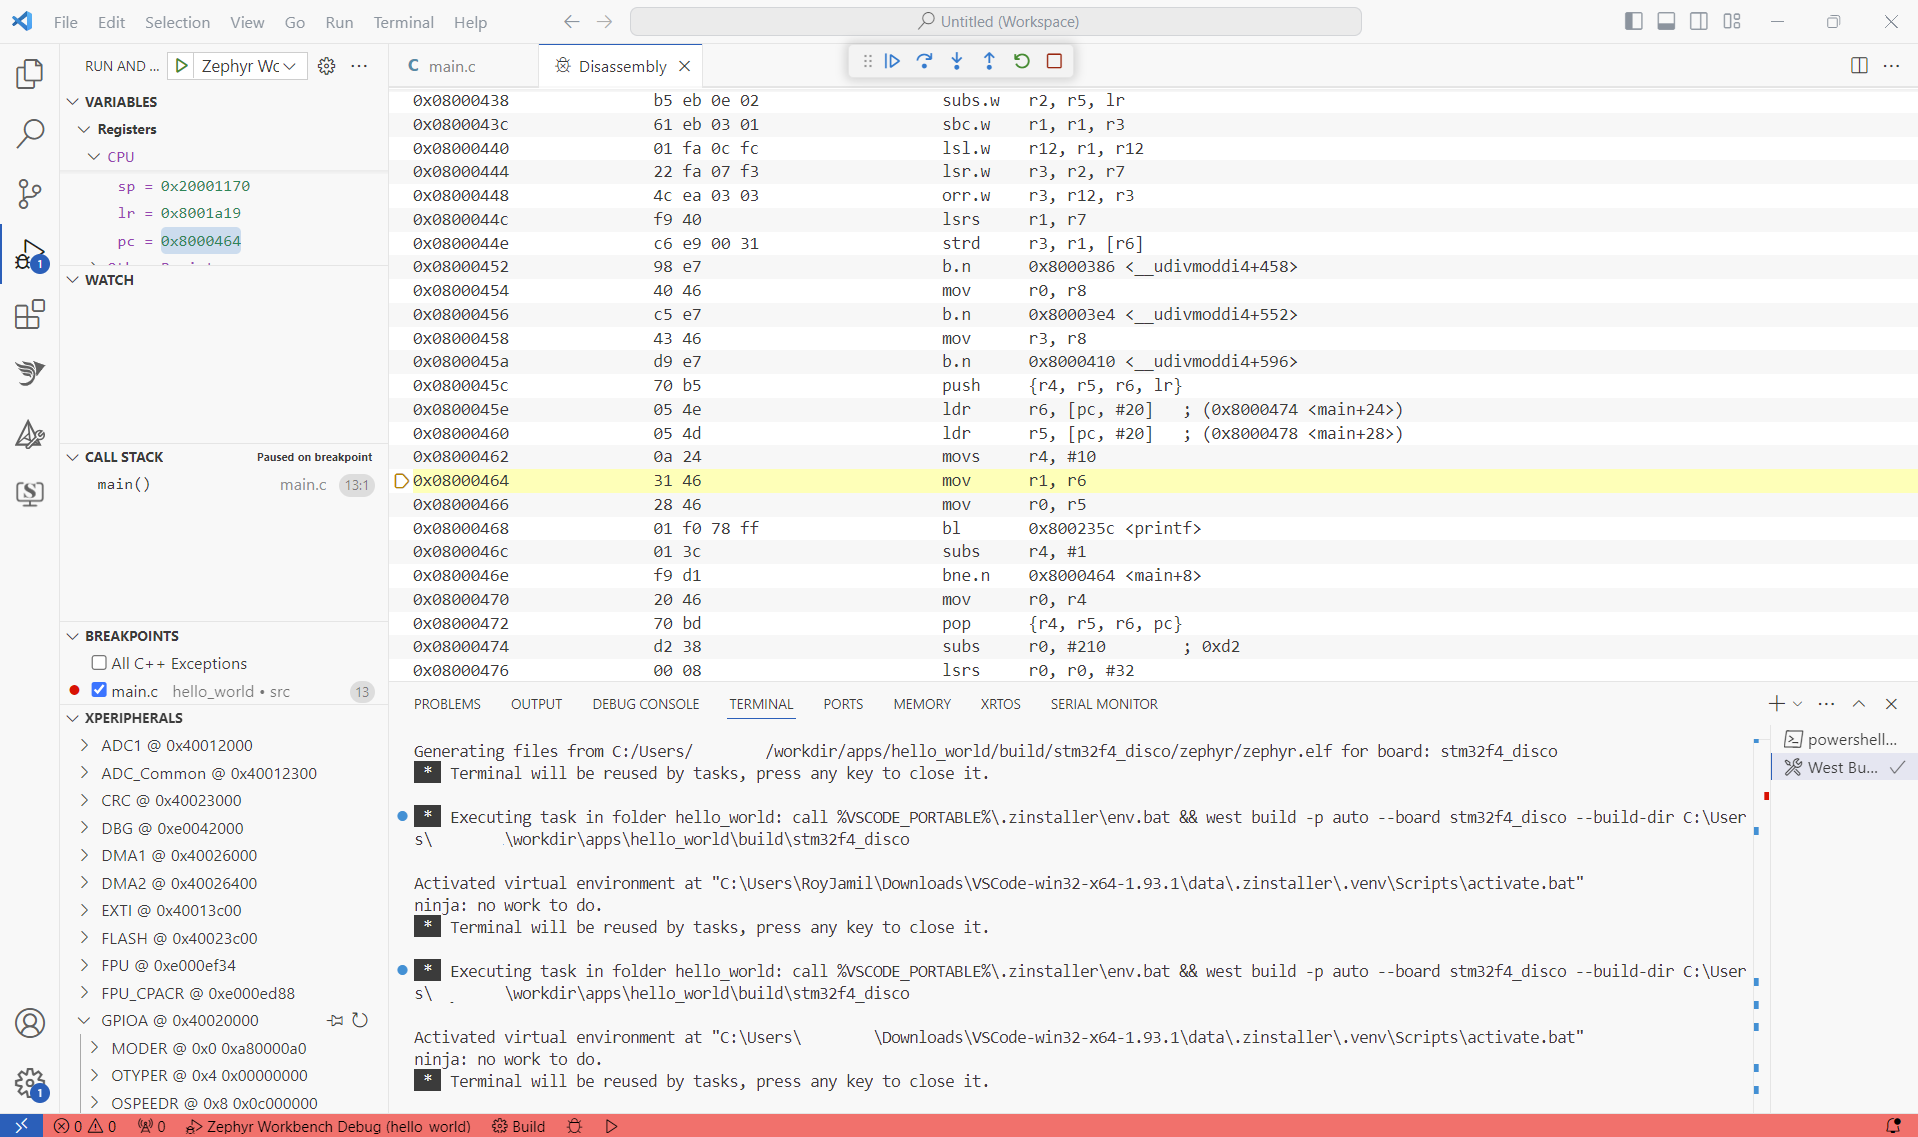
After starting the debug session, the code should breaks on main or early (depends on optimization on your project).
The "Debug Toolbar" allows you to Continue/Pause, Step Over, Step Into, Step Out, Restart or , Stop
Inspect variables and CPU registers on the left panel
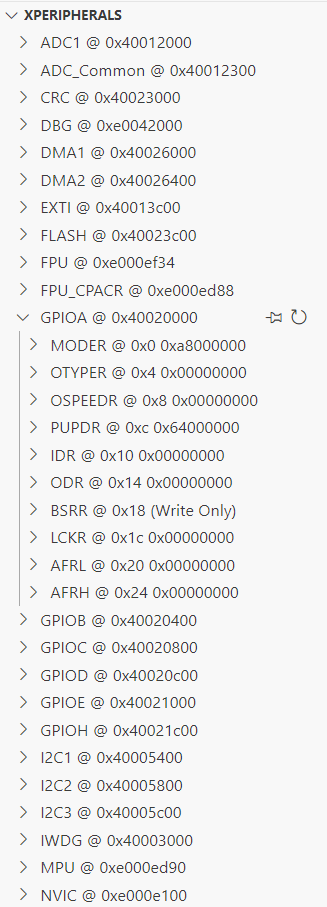
If the SVD file was set in the debug configuration, the peripherals are displayed in the "xperipherals" view.
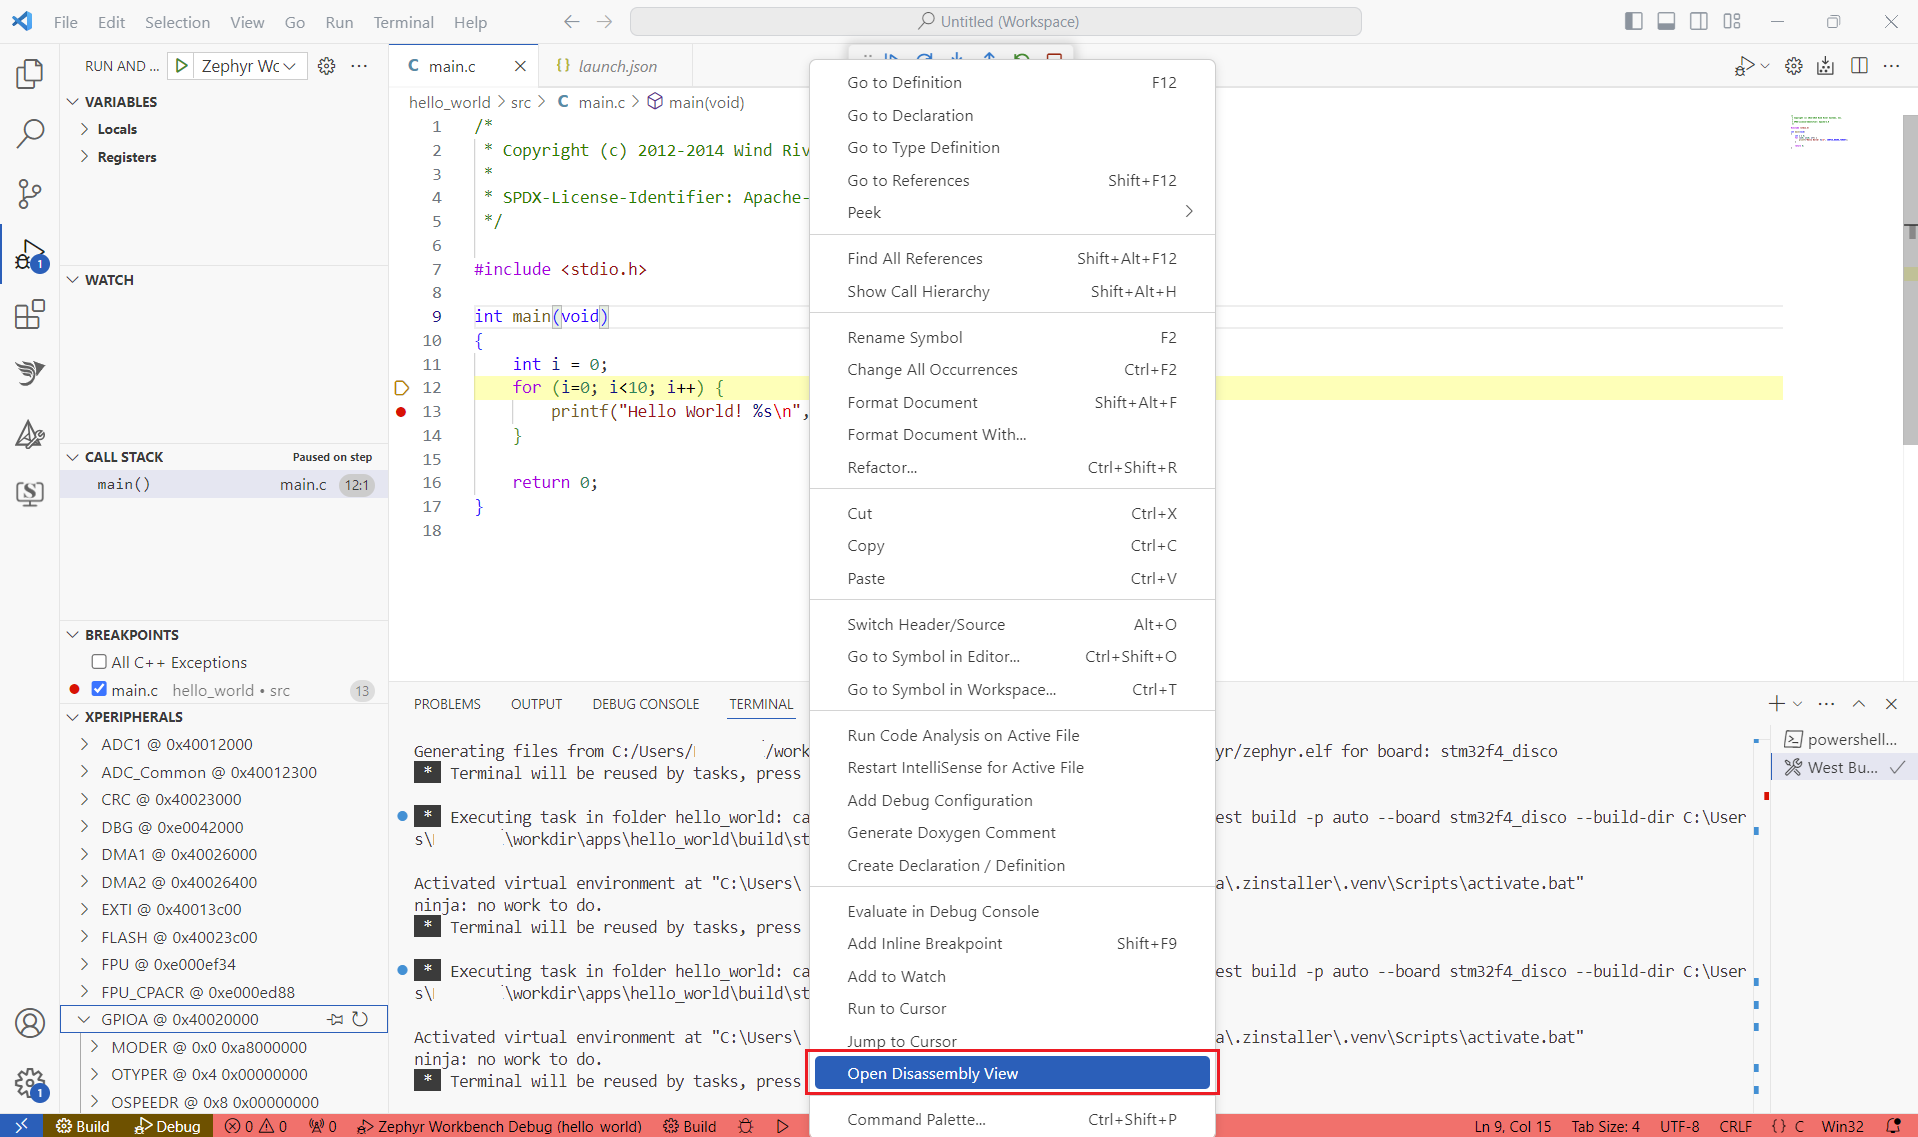
To debug in disassembly, right-click on the code then select "Open Disassembly View"
More information about Debugging on VSCODE
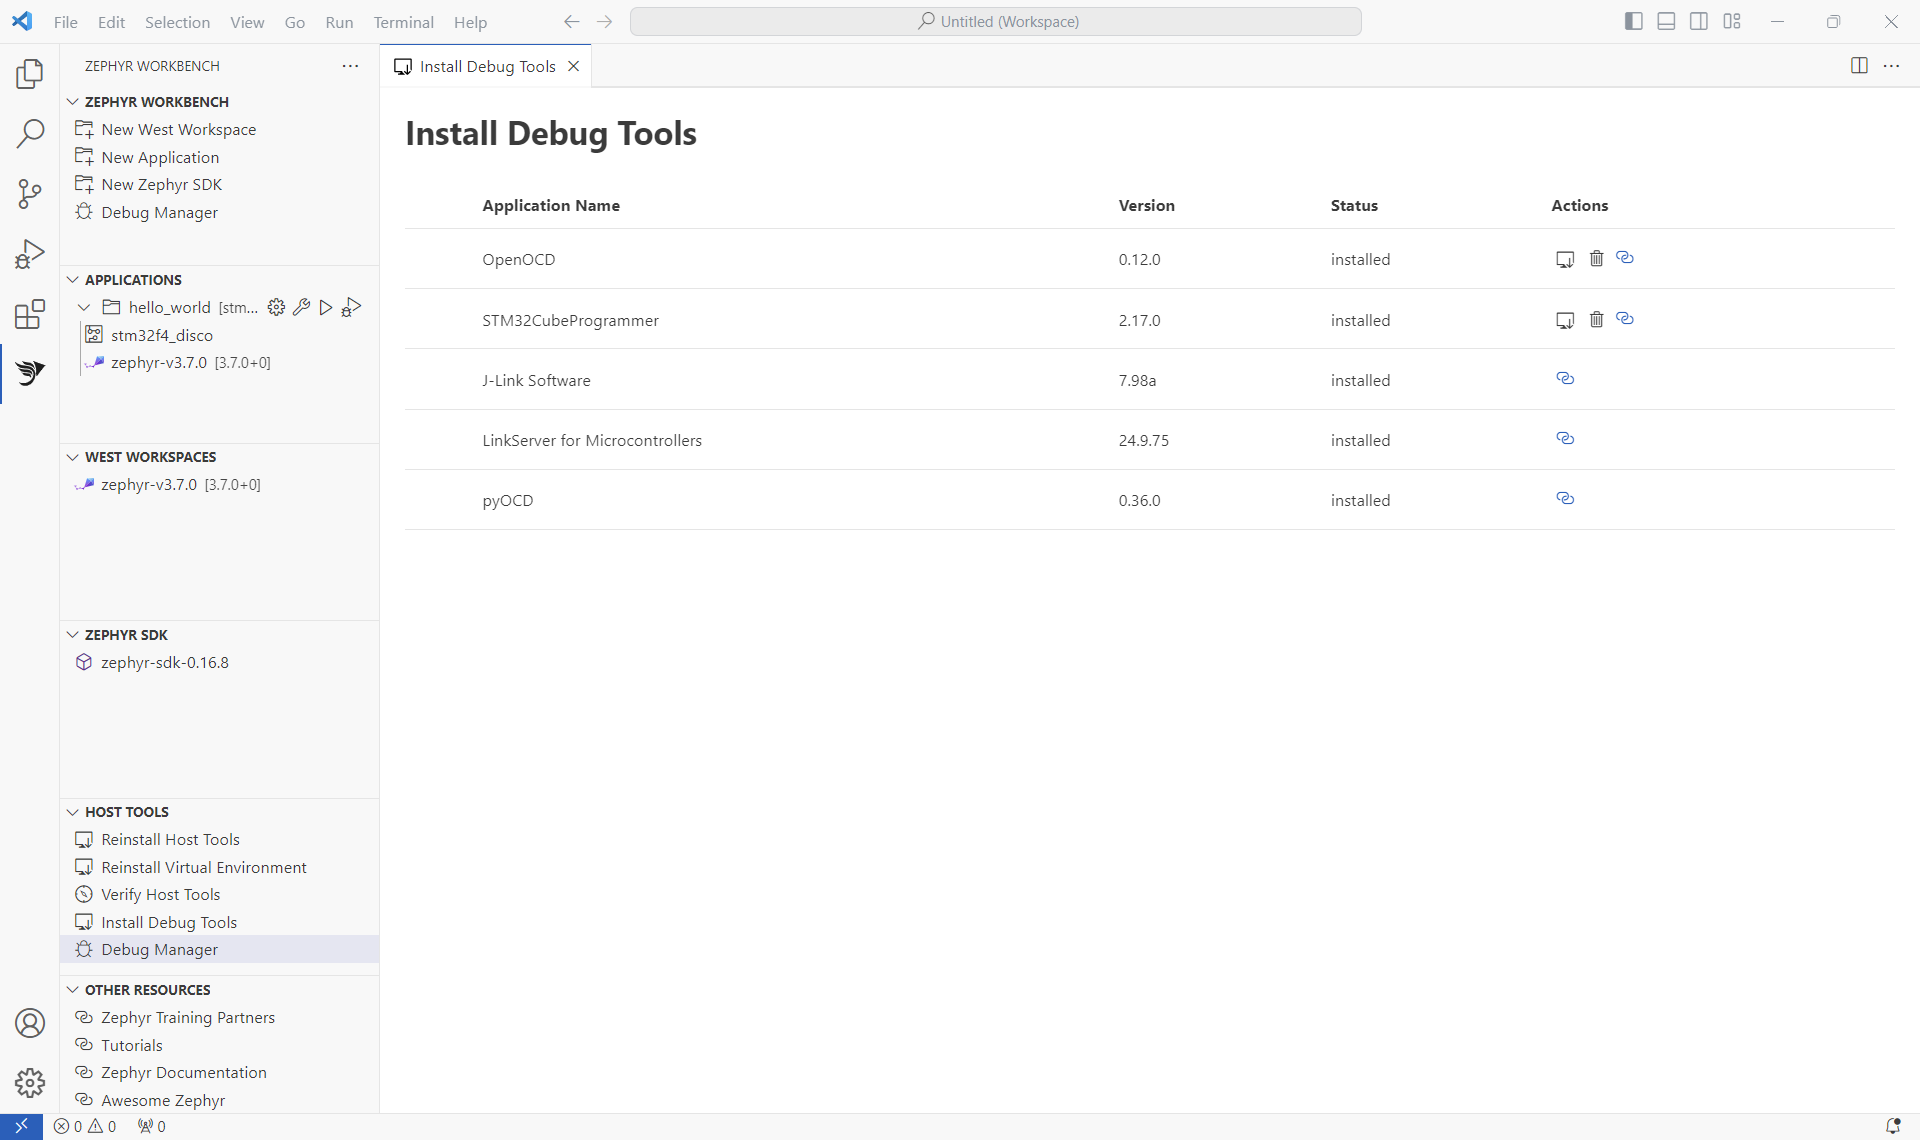
OpenOCD and STM32CubeProgrammer installers are provided.
- Click on the "Install Debug tools" menu
- The list of supported is displayed here
- Click on the "Install" icon to install the tools Click on the "Website" icon to be redirected to the official website of the tool and manually install it Note: As third-party installer cannot be fully controlled, you might need to manually set up your PATH environment variable to use the tool in Zephyr Workbench
Error message in "Output" tab with new application project is created. Uninstall tools not supported yet, please manually delete the ${USERDIR}/.zinstaller directory.
For some JTAG probes, you might need to install its driver in order to run the debug session.
git clone https://github.com/Ac6Embedded/vscode-zephyr-workbench
code vscode-zephyr-workbench
npm install
npm run compile
Then F5 to run the extension.
