Skip to content
New issue

Have a question about this project? Sign up for a free GitHub account to open an issue and contact its maintainers and the community.

By clicking “Sign up for GitHub”, you agree to our terms of service and privacy statement. We’ll occasionally send you account related emails.

Already on GitHub? Sign in to your account

Color maps could look better #238

Closed
lee1043 opened this issue Aug 24, 2017 · 34 comments
Closed

Color maps could look better #238

lee1043 opened this issue Aug 24, 2017 · 34 comments

Comments

@lee1043
Copy link
Contributor

lee1043 commented Aug 24, 2017

colormaps_uvcdat2 10_jiwoolee_20170823

Some of color maps have discrete colors at both edges. Instead of using range(16,240) for vcs.getcolors to avoid those edge colors, I think it would be much simple for users if we can make users no need to think about it.

Below code is for making above image:
plot.py.txt

@doutriaux1
Copy link
Contributor

@lee1043 in order to have vcs revert to the old behaviour (range(16,240) simply add:

vcs.utils.defaultColorsRange = range(16,240)

At the begining of your script that should solve the issue for you

@durack1
Copy link
Member

durack1 commented Aug 24, 2017

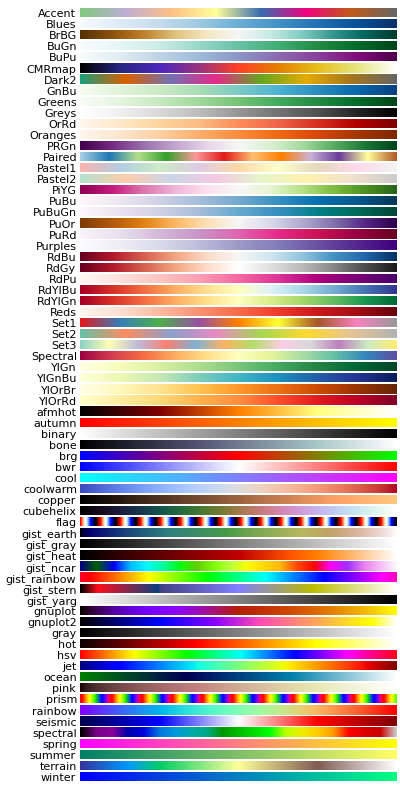
@lee1043 this is great, thanks for kicking this off.. I've been begging for this for a while CDAT/cdat#906 and #98

There seems to be quite a large number of dupes in the #238 (comment) above, so blue2green == blue_to_grn, blue2grey == blue_to_grey etc etc..

It also seems to be missing a large number of the palettes that @chaosphere2112 managed to find back in CDAT/cdat#1345 (comment), from @chaosphere2112's stuff, I also noted how many unique matplotlib colormaps were available, see CDAT/cdat#1345 (comment), plus all the additional colormaps that I provided through to @chaosphere2112 in CDAT/cdat#1345 (comment) (the bottom right thicker panels) which can be found in the file https://github.com/durack1/durolib/blob/master/lib/colourLib.py

Happy to iterate and tweak these alongside you..

And so we have everything in one place..

The matplotlib colormaps:

And the @chaosphere2112 maps from Dec 2015
colormaps

@jypeter
Copy link
Member

jypeter commented Aug 25, 2017

Thanks @lee1043 for the useful script! Some version of it would be useful in the gallery

Several color related questions for @doutriaux1 et al:

  • do we still have something like the old x.colormapgui()? Or some kind of widget that would allow the user to browse the existing colormaps?
  • I had never heard of x.util.*, eventhough some of the functions in there look familiar. Is this documented somewhere? I have failed to find something about this (and something recent about colormaps) in the uvcdat web site. Of course, the fact that there is no Search button did not help :( What happened to the Search field? cdat.github.io#129
  • Is there an easy way to revert the order of colors in a colormap? eg I want ''rainbownogreen" for temperature and I need it in blue to red order?
  • One of the major vcs limitations in the good old cgm/gks days (when plotting was easier and faster) was that you could only use 256 colors at a given time on a canvas, and I had to do a lot of custom colormaps generation. Is it possible now to use different colormaps for different plots on the same canvas

I have recently heard about a useful set of colormaps, with a matching nice documentation: http://matplotlib.org/cmocean/

@doutriaux1
Copy link
Contributor

  • @jypeter colormapgui() is dead, in the process of being re-implemented in vcdat
  • @jypeter good point about vcs.utils, I will create an issue to make a jupyter notebook about it. readthedocs eventually will have it as well.
  • just pass the reverted colors to the graphics method, example:
import vcs
gm = vcs.createisofill()
gm.colormap = "rainbow"
levels = [1,2,3,4,5]
colors = vcs.getcolors(levels,colors=range(255,-1,-1))
gm.fillareacolors=colors
  • as demonstrated above, each graphic method can now have its own colormap, the colormap used is decide in this order: graphic_method -> canvas -> vcs module
import vcs
x=vcs.init()
gm=vcs.createisofill()
# First way setting colormap at vcs level
vcs._colorMap = "viridis"
# Second way at the canvas level
x.setcolormap("inferno")  # superseeds vcs colormap
# Third way at gm level
gm.colormap = "plasma"  # superseeds canvas

@lee1043
Copy link
Contributor Author

lee1043 commented Aug 28, 2017

@doutriaux1 Color shrinking for some horizontal bars is not dependent to selection of color map. See below. Should be something related to EzTemplate? Weird...

colormaps_uvcdat2 10

plot2.py.txt

@doutriaux1
Copy link
Contributor

@lee1043 I think so, something in EzTemplate, althoguh template.data.x1 and template.data.x2 are constant. Sorry didn't have time to look at it yet.

@lee1043
Copy link
Contributor Author

lee1043 commented Aug 28, 2017

@durack1 @doutriaux1 @chaosphere2112

Maybe having matplotlib color maps in VCS related to below?

vcs.colors.matplotlib2vcs

https://uvcdat.llnl.gov/docs/vcs/misc/colors.html
https://uvcdat.llnl.gov/docs/_modules/vcs/colors.html

I will test it. Any comment welcome.

@lee1043
Copy link
Contributor Author

lee1043 commented Aug 28, 2017

@durack1 I believe below is that @chaosphere2112 was working on at CDAT/cdat#1345 (comment). Could use vcs.colors.matplotlib2vcs to get all available color maps from matplotlib.

colormaps_matplotlib_vcs

Plotting code:
visualize_colormaps_matplotlib2.py.txt

@durack1
Copy link
Member

durack1 commented Aug 28, 2017

@lee1043 I know that if you put a trailing _r on the matplotlib colormaps (so e.g. RdBu_r) you get the inverted colormap in this case the inverse of RdBu just FYI, I think this works for most colormaps

@doutriaux1
Copy link
Contributor

@lee1043 I worte the code to convert mpl colormap so yes you can import mpl colormap. Not sure the _r trick will work though, it might be at plotting time kind of trick. Personally I still don't see the usefullness on having an inverted colormap when all you need to do is colors[::-1] once you got your colors...

@lee1043
Copy link
Contributor Author

lee1043 commented Aug 28, 2017

@durack1 @doutriaux1 I can load _r color maps from matplotlib and convert them to VCS as like they are independent color maps. Just didn't listed them on the image to avoid image becomes very long in vertical.

@lee1043
Copy link
Contributor Author

lee1043 commented Aug 31, 2017

@doutriaux1 @durack1 friendly reminder: it would be nice if we can have matplotlib colormaps already in it when vcs is imported and initialized.

@taylor13
Copy link

taylor13 commented Aug 31, 2017

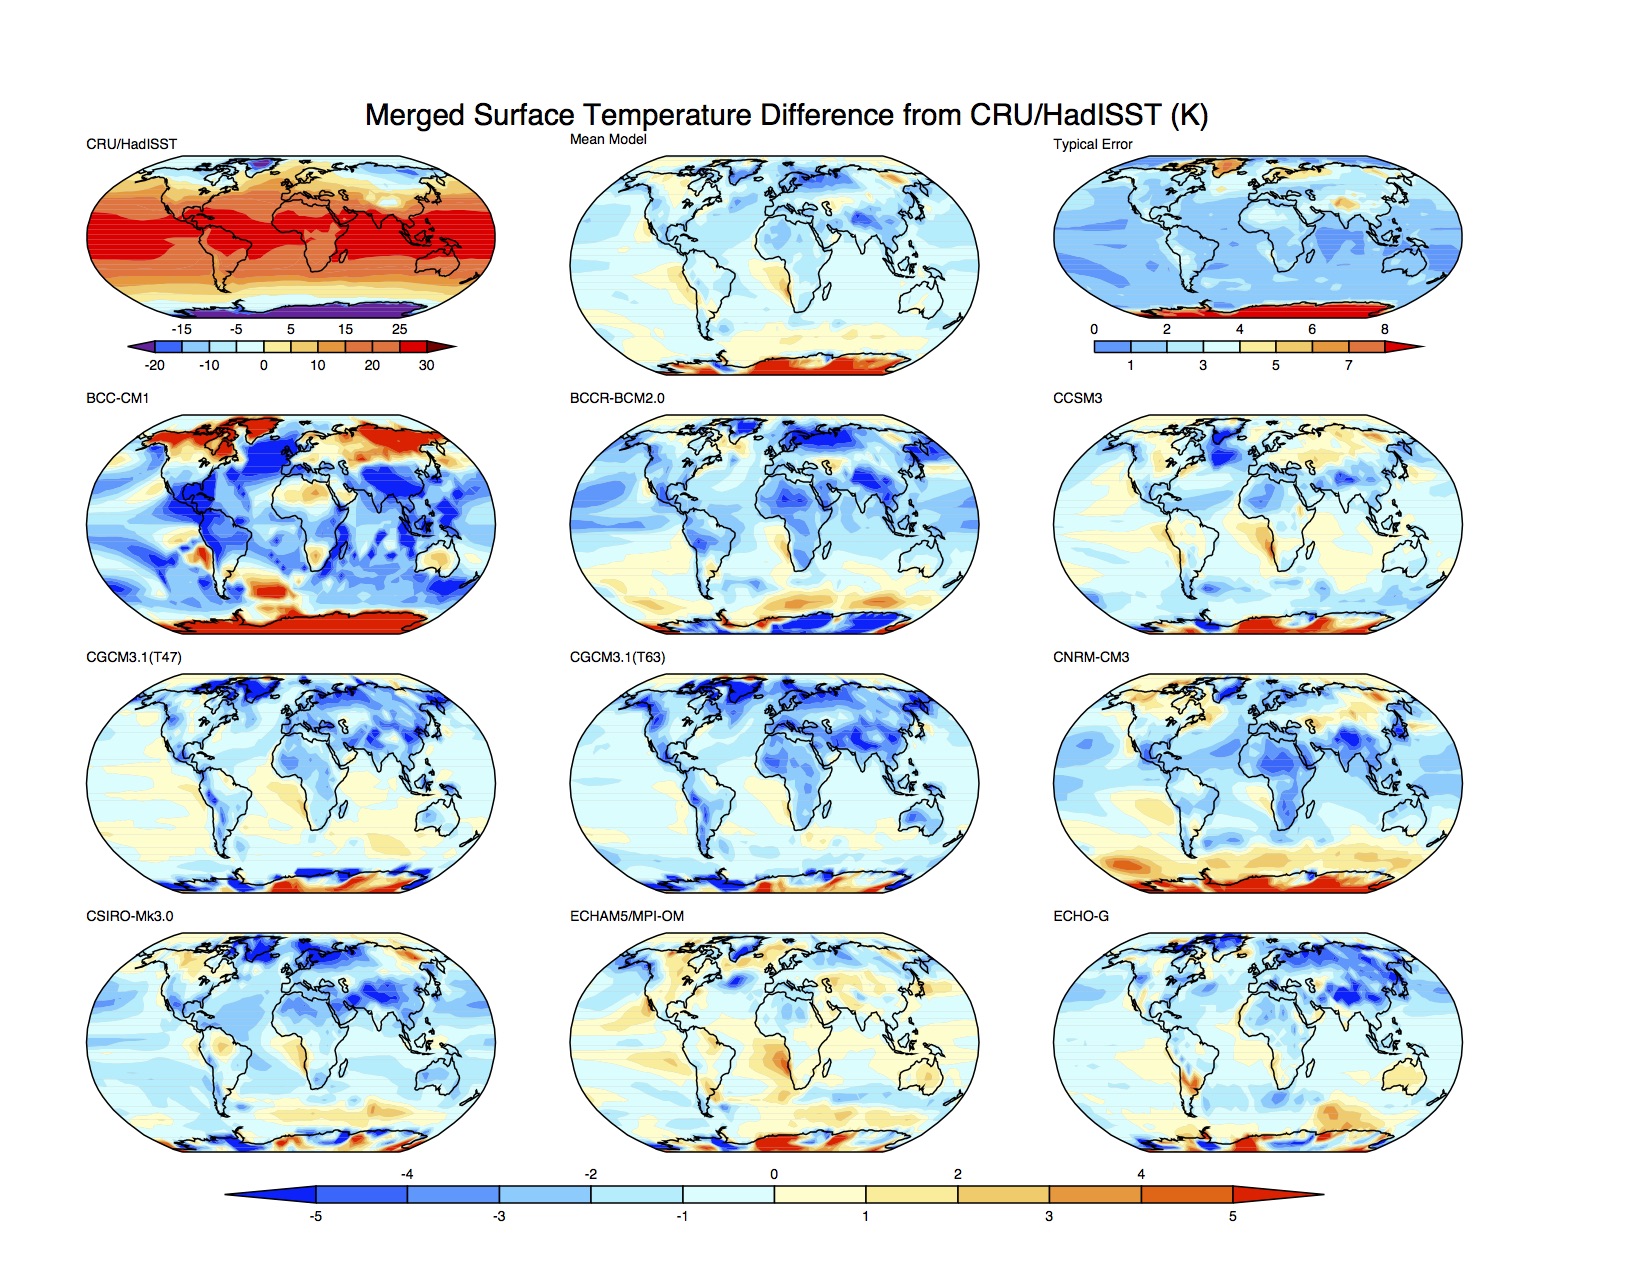
Below are some sample figures from the set I produced for the IPCC AR4. Some of these color bars are pretty good I think. I'll also include the color table and the code used to produce these plots. (scroll down)
pr_obs
rlut_page_1_diff
tasm_page_1_diff
tasm_mean_diff
tasm_obs
pr_page_1_diff
Here's the code:
plot_ipcc_ar4_taylor.py.txt

and here's the colormap used:
C_pcmdi.txt

@durack1
Copy link
Member

durack1 commented Sep 1, 2017

@doutriaux1 it would be great if we could pull @taylor13's colormaps into VCS as well so they are also available without having to locate another file somewhere.. We could potentially have a dictionary with default palettes, and these (and Ken's, my extras etc) could all be placed in an auxiliary colormap dictionary.. So be there sitting beside the default but not confuse a new user as you indicated was the reason why the large number of palettes was removed..

@aashish24
Copy link
Contributor

+1 where is the definition of @taylor13 colormaps?

@doutriaux1
Copy link
Contributor

that's what your initial.attribute file is for. I'm open to stick it as part of pmp. Or make an external, separate package with a bunch of vcs templates, colormaps, graphic methods etc..., organized by project/themes.

@doutriaux1
Copy link
Contributor

@durack1 I have to balance between user that want everything in the kitchen sink and those who wants a faster more efficient vcs...

@durack1
Copy link
Member

durack1 commented Sep 1, 2017

@doutriaux1 why fracture things out of VCS, it's colormaps so just put them all into the VCS module, rather than fragmenting them around between UV-CDAT, the PMP, CDP or whatever..

Having some additional colour maps will increase the package size by KBs, and what I proposed above meant that you would ship them with the module, but not have them load with the default colour maps when VCS is imported - no issue with time/efficiency

@durack1
Copy link
Member

durack1 commented Sep 1, 2017

+1 where is the definition of @taylor13 colormaps?

@aashish24 see #238 (comment) above

@doutriaux1
Copy link
Contributor

@durack1 because

  • it takes resources to load them in everytime
  • people complained before there was too many of them and they made no sense to them

@jypeter
Copy link
Member

jypeter commented Sep 1, 2017

@doutriaux1 btw is there a page or pdf somewhere that says what the different elements of a template are (what they are for and where there are by default on a canvas)?

I know a bunch and I do trial/error otherwise but I was trying to tell a new user about templates yesterday and having something to show to the users would be nice. I have found some of your old tutorials, but none has a page that would show where the elements are (or what they are for). A bit like the template editor

@doutriaux1
Copy link
Contributor

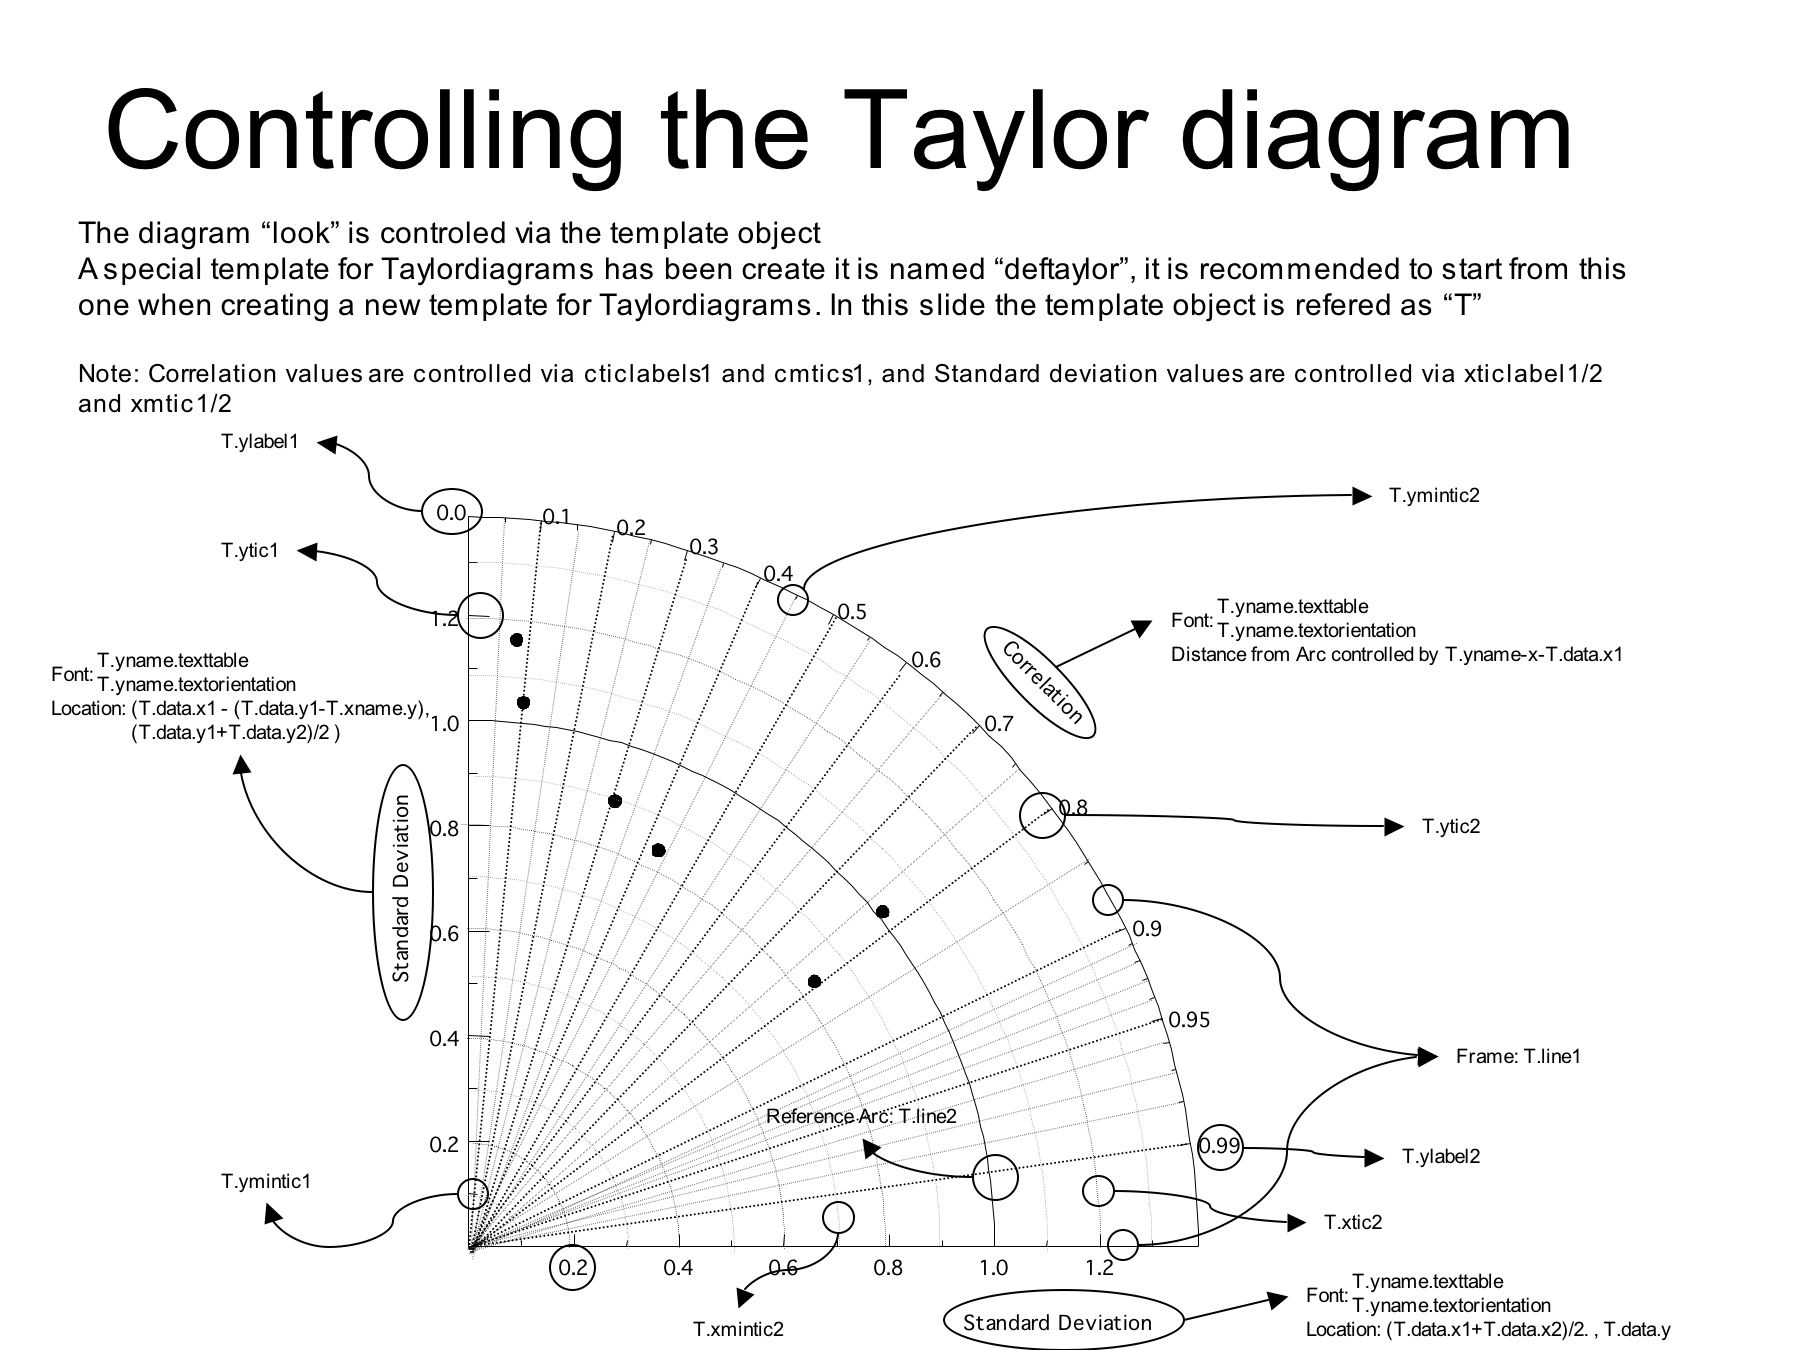
@jypeter yes there are. I need to put thme somewhere

VCS Template

template_asd3

Taylor diagrams

taylorctl

@CDAT CDAT deleted a comment from durack1 Sep 1, 2017
@lee1043
Copy link
Contributor Author

lee1043 commented Sep 1, 2017

@doutriaux1 That graphic is really helpful! Thanks for sharing.

@lee1043
Copy link
Contributor Author

lee1043 commented Sep 1, 2017

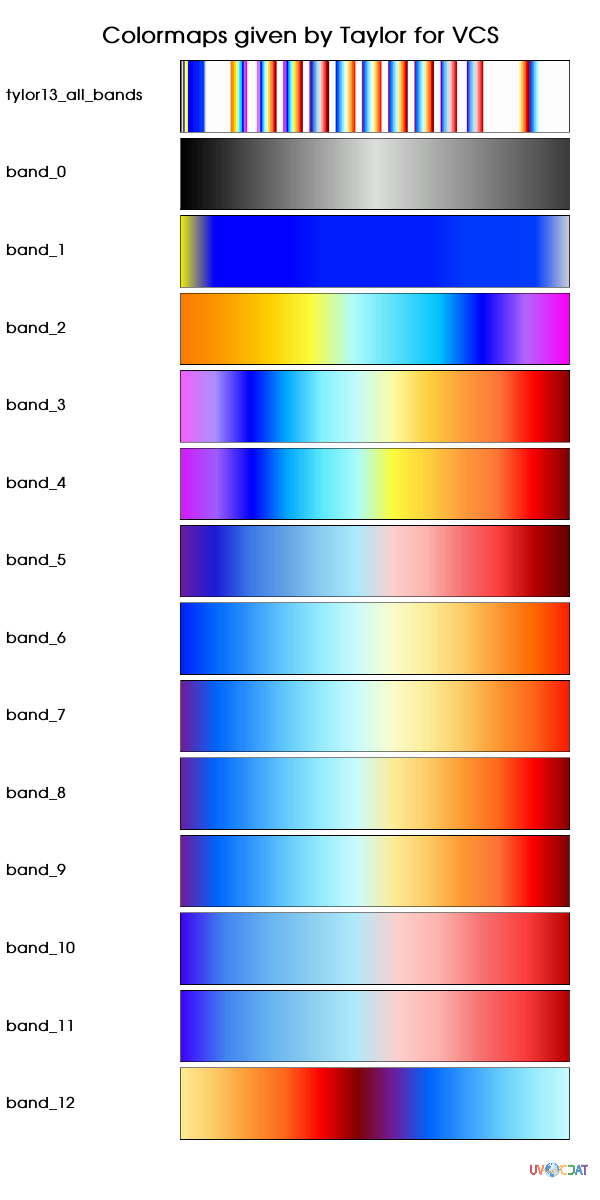
Visualization of @taylor13's color maps, C_pcmdi given at #238 (comment)

test_taylor_cmap

@taylor13
Copy link

taylor13 commented Sep 2, 2017

As I recall the different variants on the same color map, all contained in one file are designed for different numbers of contours. It would be easier to to see this if you spread out each of the bands in the figure above, placing each on a new row (so instead of a single row, 11 color rows; and I think there are some grey scale options in slots 0-40.

@jypeter
Copy link
Member

jypeter commented Sep 4, 2017

Thanks @doutriaux1 ! That's (the template objects' names) a typical example where a nice figure is better than a notebook

@lee1043
Copy link
Contributor Author

lee1043 commented Sep 5, 2017

@taylor13 I believe below is what you suggested. Each of the bands was stretched to have 240 color levels. LinearSegmentedColormap of matplotlib (details here) was applied to spread certain numbers of colors to 240 levels, and vcs.colors.matplotlib2vcs was applied to convert it to VCS colormaps.

test_taylor_cmap_stretch

Sharing below code for future reference:
taylor_colormaps_stretch.py.txt

@durack1
Copy link
Member

durack1 commented Sep 5, 2017

@lee1043 and nice work on these palettes! @taylor13 thanks for your tireless work back in the dark ages of VC-DAT too!

@lee1043
Copy link
Contributor Author

lee1043 commented Sep 5, 2017

@taylor13 Thanks for clarifying what you were looking for and here it is:

test_taylor_cmap_discrete

Plotting code:
taylor_colormaps_discrete.py.txt

@jypeter
Copy link
Member

jypeter commented Sep 6, 2017

Nice!

@doutriaux1 are the last 16 color indices still protected so that you are sure to always get the same 16 basic colors for lines, text, etc? Because I tried to use red and green (indices 253 and 254 or something like that) when using bl_to_darkred, but the colors I got were more yellow-orange, like in the middle of bl_to_darkred

@doutriaux1
Copy link
Contributor

@jypeter no since 2.10 there's no more protected colors. I know it's a pain for older colormaps. This might get better in 3.0 we have ideas for colormaps.

@lee1043
Copy link
Contributor Author

lee1043 commented Sep 29, 2017

@doutriaux1 Could you remind me what was the one single line commend to bring all matplotlib colormaps in?

@doutriaux1
Copy link
Contributor

vcs.utils.loadmatplotlibcolormaps()

@lee1043
Copy link
Contributor Author

lee1043 commented Sep 29, 2017

@doutriaux1 Thanks!

Sign up for free to join this conversation on GitHub. Already have an account? Sign in to comment
Projects
None yet
Development

No branches or pull requests

6 participants