Helper package with multiple U-Net implementations in Keras as well as useful utility tools helpful when working with image segmentation tasks
- U-Net models implemented in Keras
- Vanilla U-Net implementation based on the original paper
- Customizable U-Net
- U-Net optimized for satellite images based on DeepSense.AI Kaggle competition entry
- Utility functions:
- Plotting images and masks with overlay
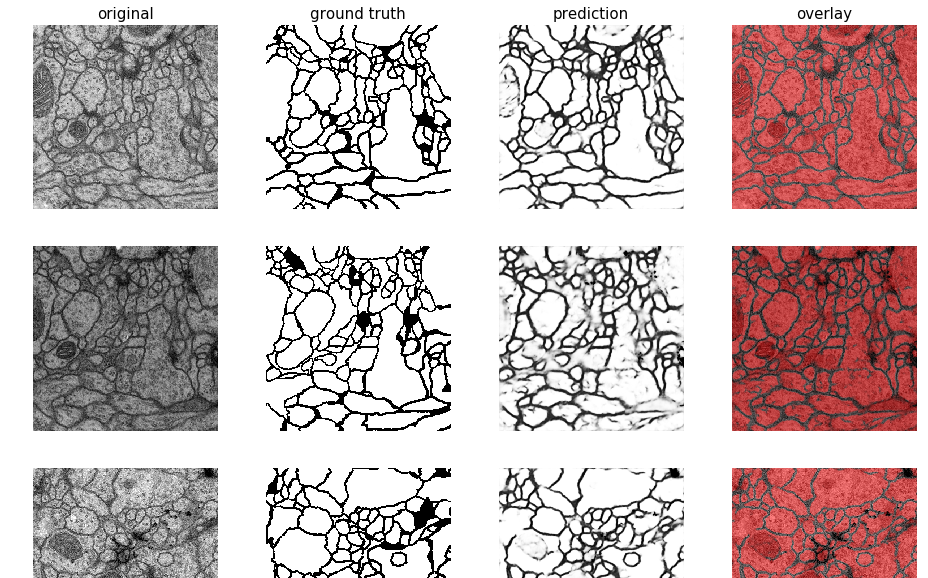
- Plotting images masks and predictions with overlay (prediction on top of original image)
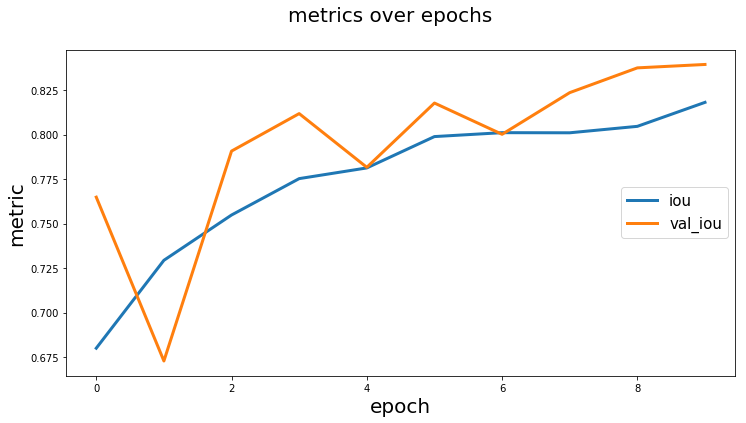
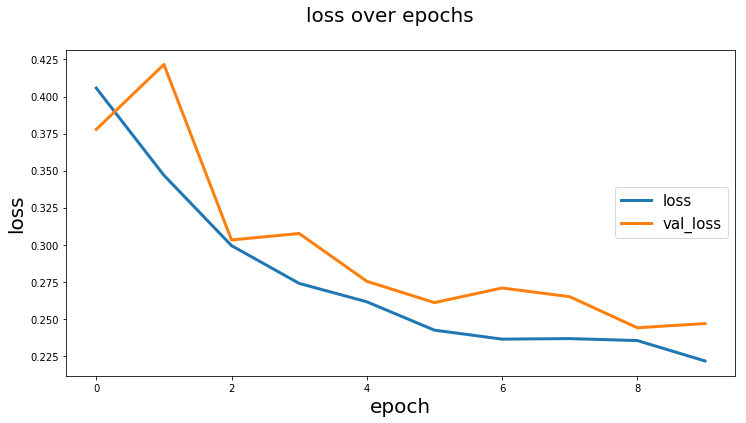
- Plotting training history for metrics and losses
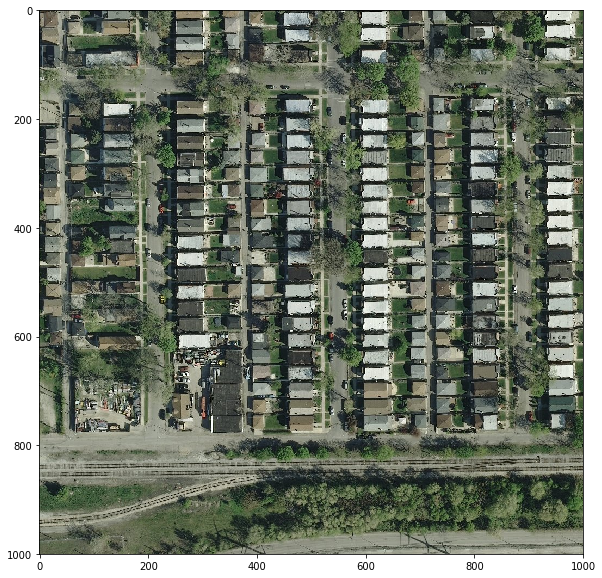
- Cropping smaller patches out of bigger image (e.g. satellite imagery) using sliding window technique (also with overlap if needed)
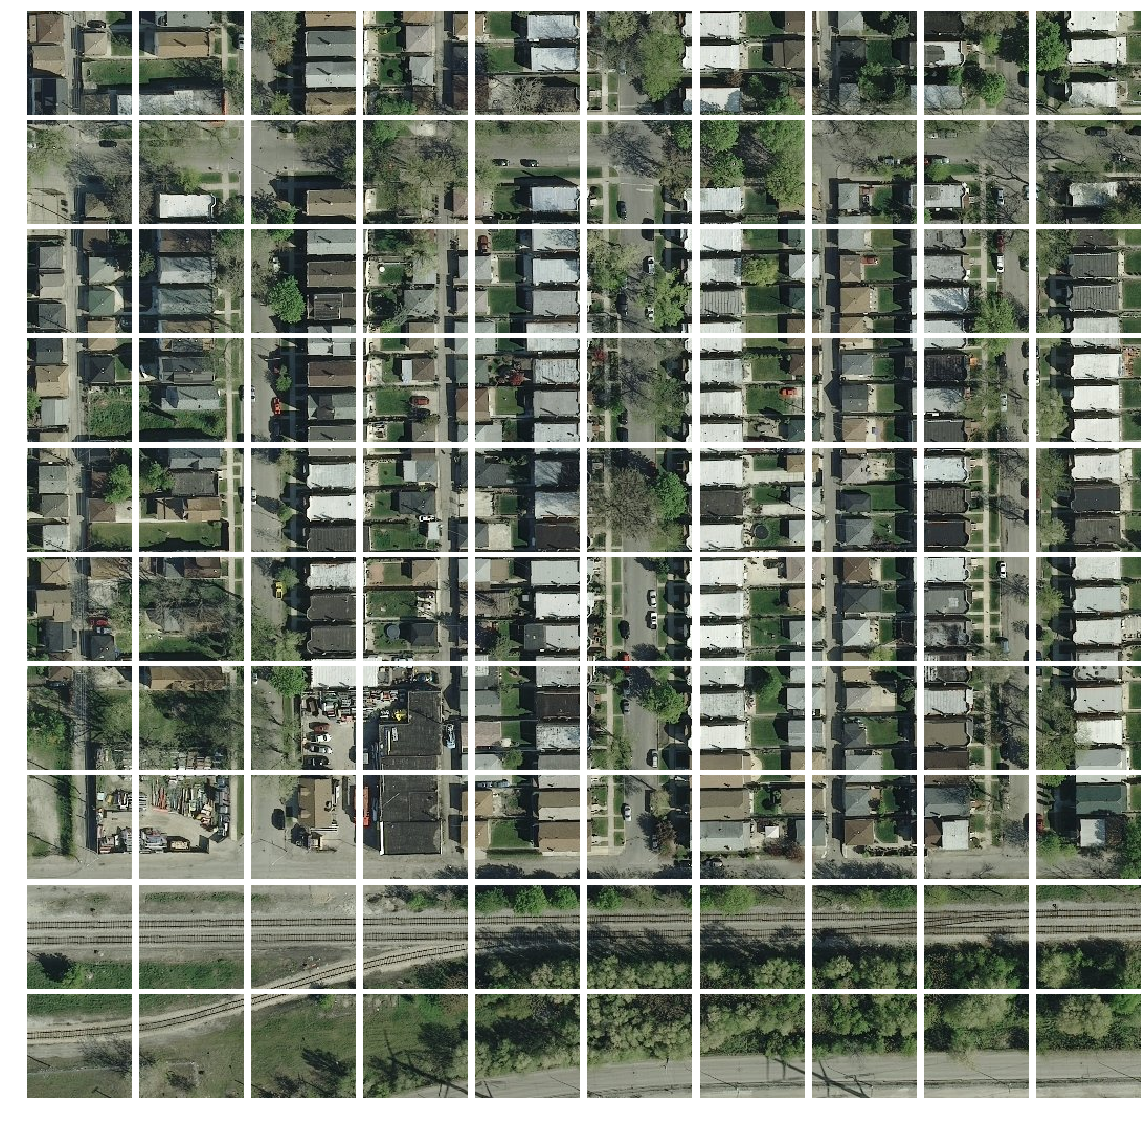
- Plotting smaller patches to visualize the cropped big image
- Reconstructing smaller patches back to a big image
- Data augmentation helper function
- Notebooks (examples):
- Training custom U-Net for whale tails segmentation
- Semantic segmentation for satellite images
- Semantic segmentation for medical images ISBI challenge 2015
pip install git+https://github.com/karolzak/keras-unetor
pip install keras-unet- U-Net implementations in Keras:
- Utils:
Model scheme can be viewed here
from keras_unet.models import vanilla_unet

model = vanilla_unet(input_shape=(512, 512, 3))Model scheme can be viewed here
from keras_unet.models import custom_unet

model = custom_unet(
    input_shape=(512, 512, 3),
    use_batch_norm=False,
    num_classes=1,
    filters=64,
    dropout=0.2,
output_activation='sigmoid')Model scheme can be viewed here
from keras_unet.models import satellite_unet

model = satellite_unet(input_shape=(512, 512, 3))history = model.fit_generator(...)
from keras_unet.utils import plot_segm_history
plot_segm_history(
history, # required - keras training history object
metrics=['iou', 'val_iou'], # optional - metrics names to plot
losses=['loss', 'val_loss']) # optional - loss names to plotfrom keras_unet.utils import plot_imgs
plot_imgs(
org_imgs=x_val, # required - original images
mask_imgs=y_val, # required - ground truth masks
pred_imgs=y_pred, # optional - predicted masks
nm_img_to_plot=9) # optional - number of images to plotfrom PIL import Image
import numpy as np
from keras_unet.utils import get_patches
x = np.array(Image.open("../docs/sat_image_1.jpg"))
print("x shape: ", str(x.shape))
x_crops = get_patches(
img_arr=x, # required - array of images to be cropped
size=100, # default is 256
stride=100) # default is 256
print("x_crops shape: ", str(x_crops.shape))Output:
x shape:  (1000, 1000, 3)
x_crops shape:  (100, 100, 100, 3)
from keras_unet.utils import plot_patches

print("x_crops shape: ", str(x_crops.shape))
plot_patches(
    img_arr=x_crops, # required - array of cropped out images
    org_img_size=(1000, 1000), # required - original size of the image
    stride=100) # use only if stride is different from patch size
Output:
x_crops shape: (100, 100, 100, 3)
import matplotlib.pyplot as plt
from keras_unet.utils import reconstruct_from_patches

print("x_crops shape: ", str(x_crops.shape))

x_reconstructed = reconstruct_from_patches(
    img_arr=x_crops, # required - array of cropped out images
    org_img_size=(1000, 1000), # required - original size of the image
    stride=100) # use only if stride is different from patch size

print("x_reconstructed shape: ", str(x_reconstructed.shape))

plt.figure(figsize=(10,10))
plt.imshow(x_reconstructed[0])
plt.show()
Output:
x_crops shape:  (100, 100, 100, 3)
x_reconstructed shape:  (1, 1000, 1000, 3)
