Use TSQL to perform RFM segmentation analysis on sales data.
- RFM analysis is a marketing technique used to rank and group customers based on the recency, frequency and monetary value of their recent transactions to identify the best customers and perform targeted marketing campaigns.
- The RFM model may assigns a rank of 1 through 5 (from worst to best) for customers in each of the three categories: Recency, Frequency, Monetary Value. The ideal customer would therefore have a score of 555. The higher the customer ranking, the more likely it is that they will do business again with a firm. *RFM analysis models may assign different values when ranking, it does not have to be the 1 through 5 ranking system.*
- RFM analysis helps firms reasonably predict which customers are likely to purchase their products again, how much revenue comes from new (versus repeat) clients, and how to turn occasional buyers into habitual ones. Furthremore, RFM analysis is used to identify a company's or an organization's best customers by measuring and analyzing spending habits in order to improve low-scoring customers and maintain high-scoring ones.
- Recency: How recently a customer has made a purchase.
The more recently a customer has made a purchase with a company, the more likely they will continue purchasing from that company. - Frequency: How often a customer makes a purchase.
If the purchase cycle can be predicted, for example when a customer needs to buy more groceries, then marketing efforts may be directed towards reminding them to visit the business when staple items run low. - Monetary Value: How much money a customer spends on purchases.
Customers who spend a lot of money are more likely to spend money in the future and have a high value to a business.
*NTILE(5) function is used to group the data into 5 groups. K-means, hierarchical clustering, Gaussian, Spectral Clustering were not used to group data.*
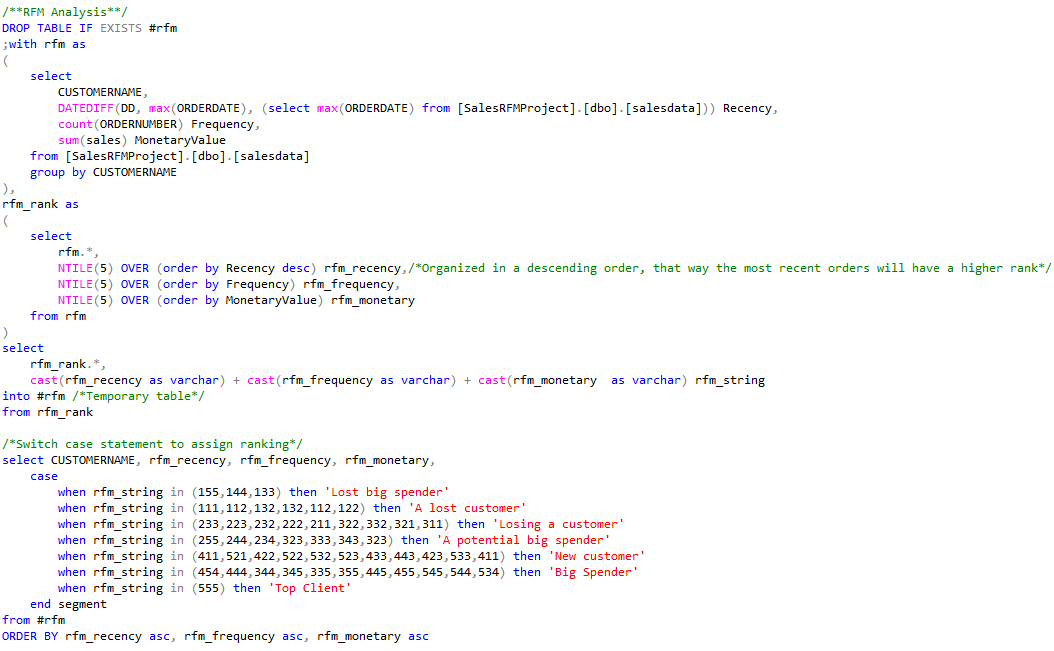
RFM Analysis Code: Click Here
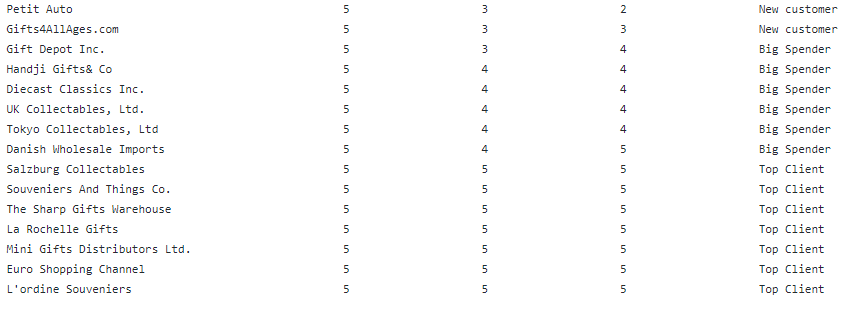
RFM Segmentation Results: Click Here