Skip to content

GoelDidi/OOP_Ex3


Folders and files

NameName
Last commit message
Last commit date

Latest commit


History

3 Commits


Repository files navigation

Weighted directed graphs

drawing

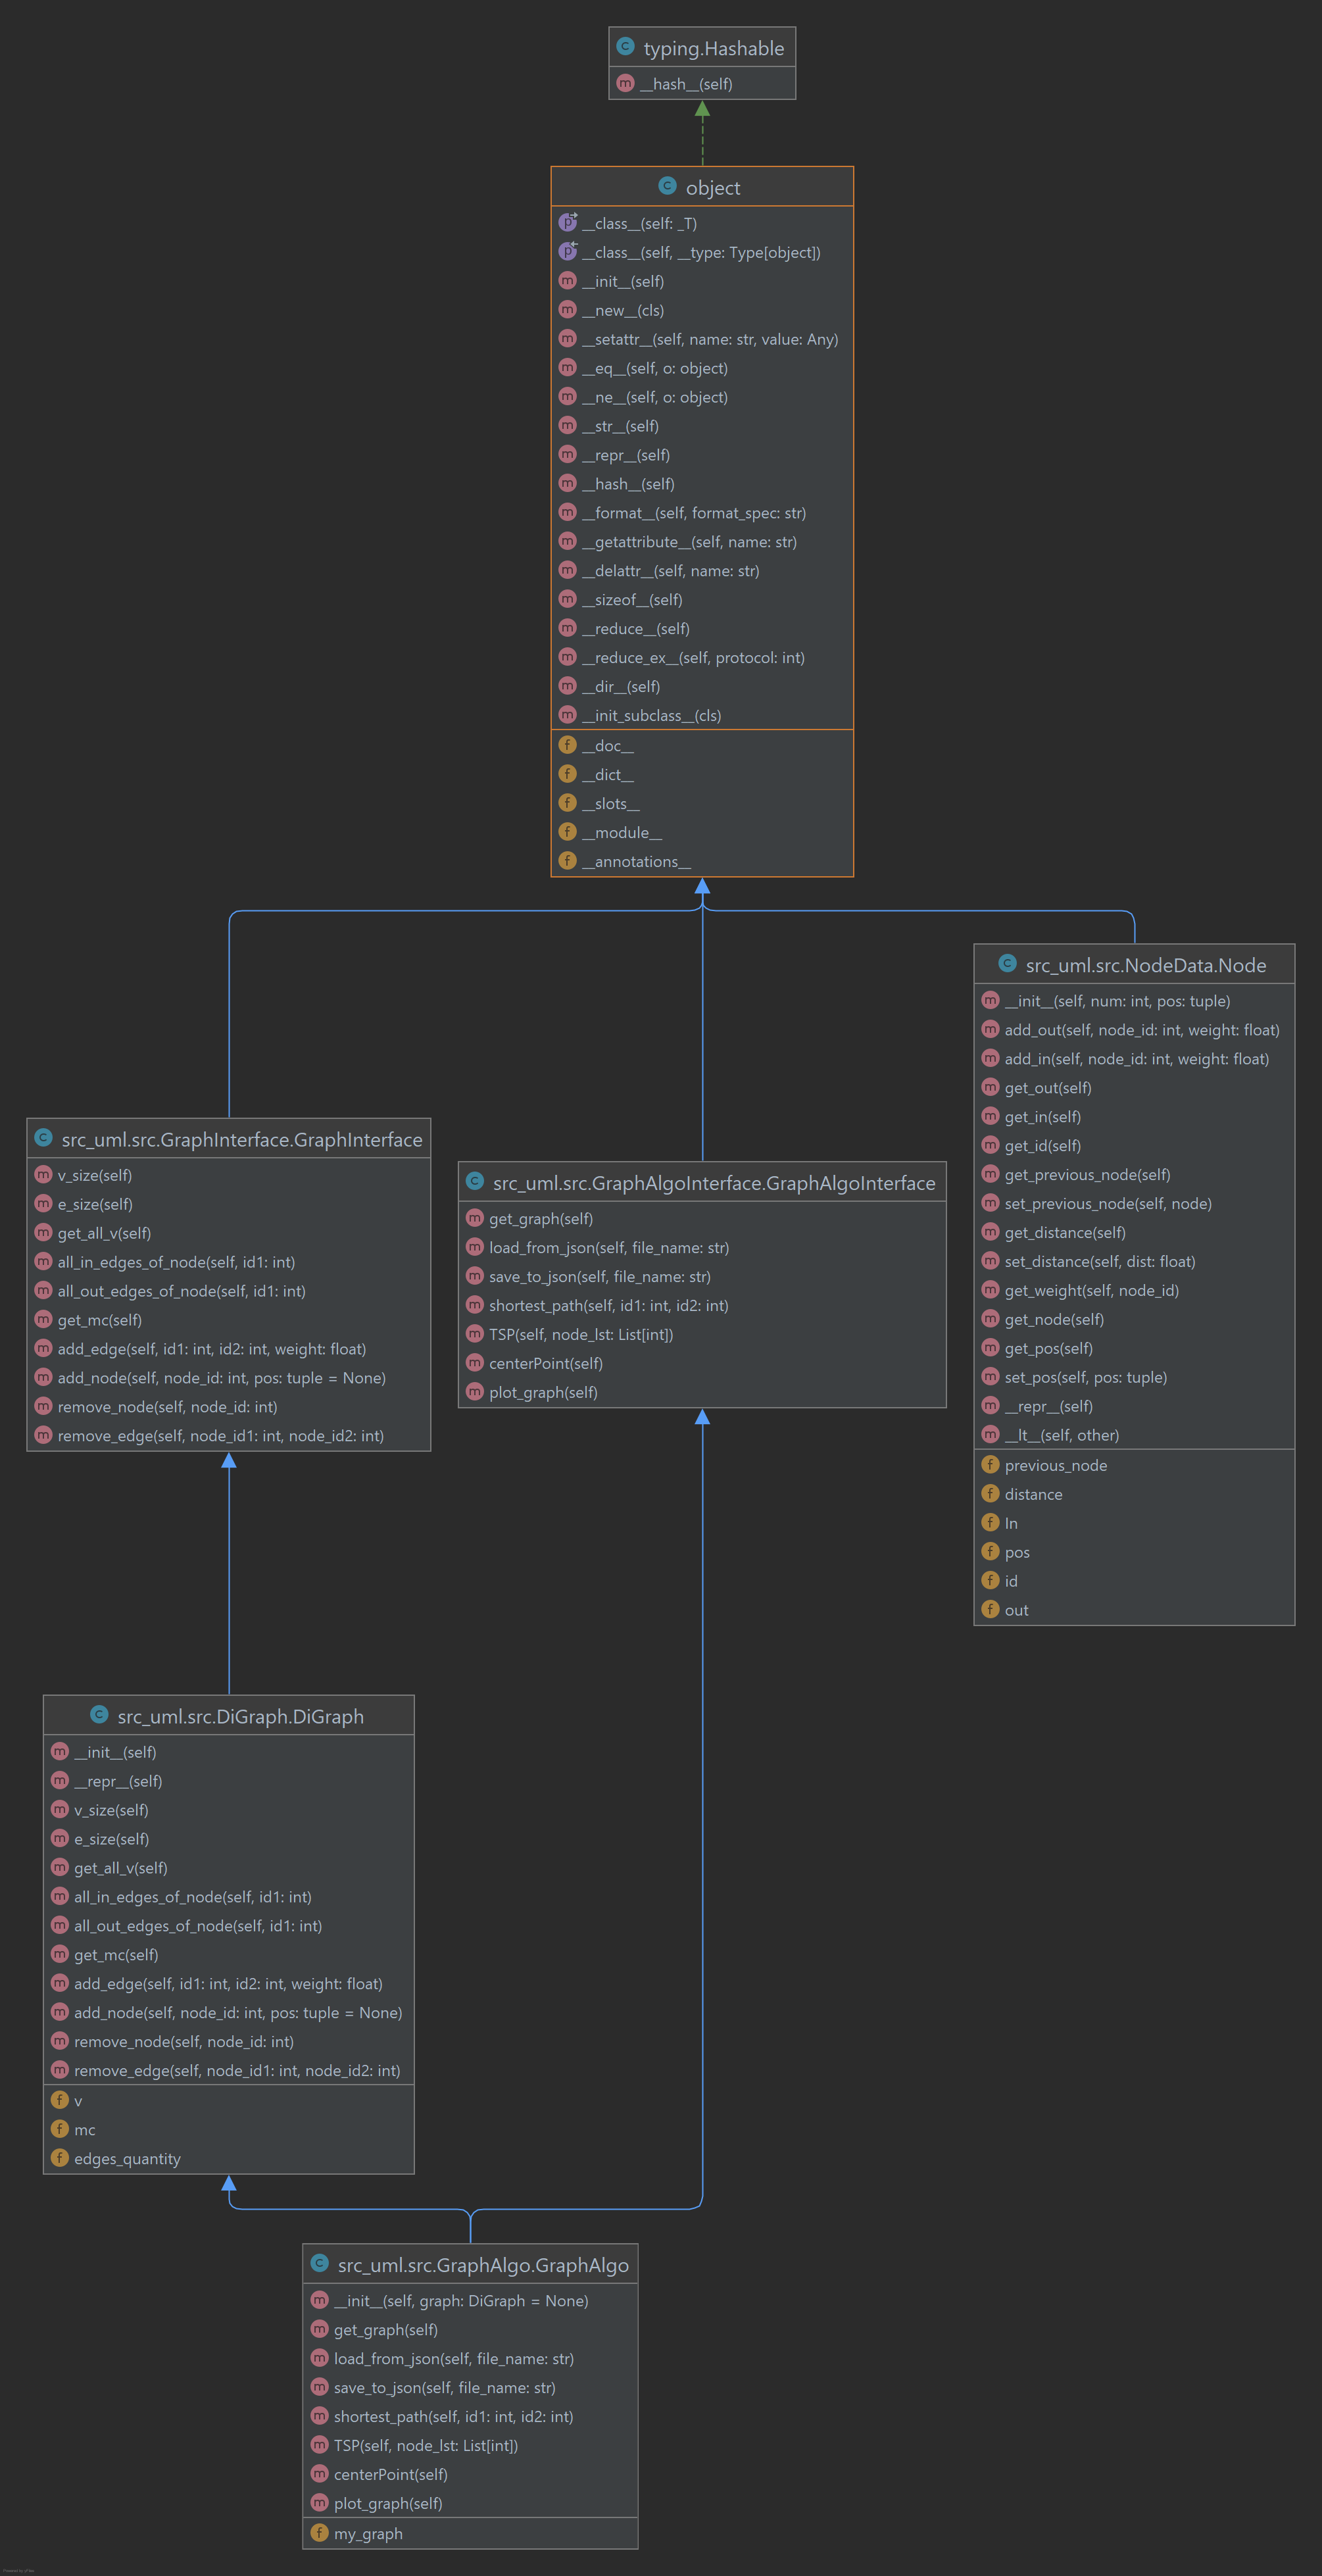
Create a weighted graph and tests shown below:

Creators

Classes:

NodeData:

  • Node class : It holds the values of the Node and Edges from this node to other nodes or other nodes to this node, and key for unique ID and his location.

DiGraph

the class import GraphInterface that represents an interface of a graph.
  • v_size: Returns the number of vertices in this graph.

  • e_size: Returns the number of edges in this graph.

  • get_all_v: return a dictionary of all the nodes in the Graph, each node is represented using a pair (node_id, node_data)

  • all_in_edges_of_node: return a dictionary of all the nodes connected to (into) node_id , each node is represented using a pair (other_node_id, weight)

  • all_out_edges_of_node: return a dictionary of all the nodes connected from node_id , each node is represented using a pair (other_node_id, weight)

  • get_mc: The current version of this graph.

  • add_edge: Adds an new edge to the graph.

  • add_node: Adds a new node to the graph.

  • remove_node: Remove a specific node from the graph.

  • remove_edge: Remove an specific edge from the graph.

GraphAlgo

This is the graphClass that all the algorithms would operate in.

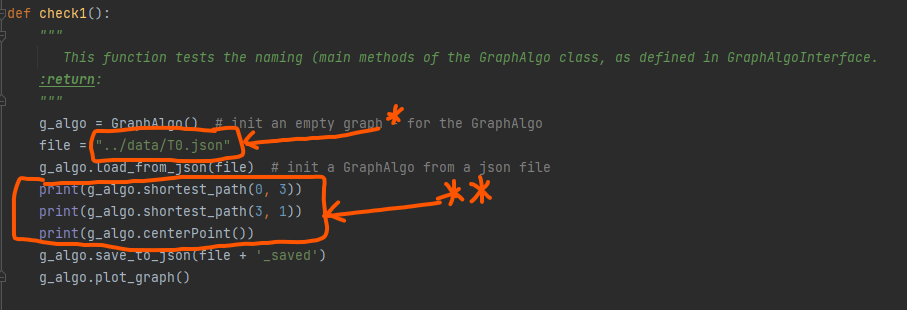
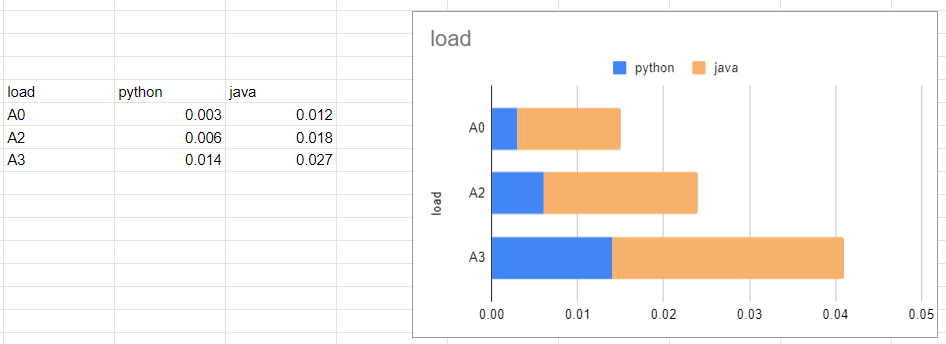
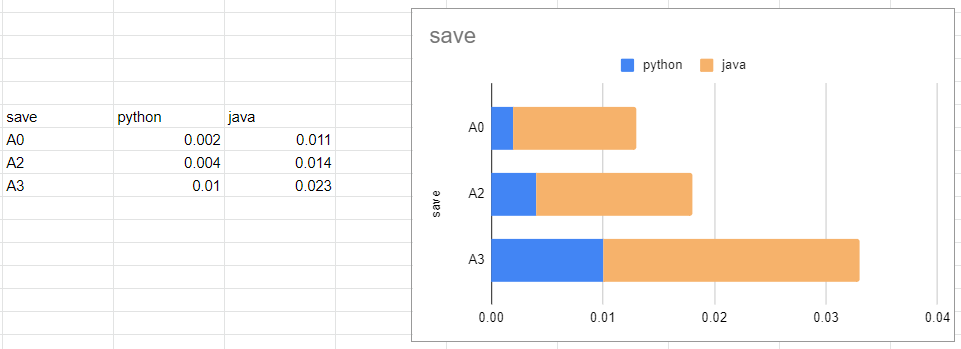
We create a graph from the previous class, and on that we will run the algorithm.

  • get_graph: returns the graph that we preforms the algorithms on.

  • load_from_json: Loads a graph from a json file.

  • save_to_json: Saves the graph in JSON format to a file.

  • shortest_path: finds the shortest path between two nodes that the function receive and returns the distance and a list of the path itself.

  • TSP: Finds the shortest path that visits all the nodes in the list of our Graph.

  • centerPoint: Finds the node that has the shortest distance to it's farthest node.

  • plot_graph: Plots the graph. If the nodes have a position the nodes will be placed there.

    Otherwise, they will be placed in a random spot.

matplotlib

  • This is a class that receives a graph after the creation of nodes and the edges and the class creates a graphical interface on the screen:

  • plot_graph - we using this in GraphAlgo class and the function takes the lists of the graph that include the position of the nodes and the eges that connect the nodes and draw it on our screen like that (A3): A3

Run time

A0,A2,A3 Tests

tsp center shortest load save

UML

src_uml

Run Locally

Clone the project

  git clone https://github.com/Michael-Aga/OOP_Ex3.git

The project can run in 2 ways:

1) use one of the existing tests in the main or build a graph yourself:

1

2) load json file * and Write down the functions you want to test ** :

2

About

No description, website, or topics provided.

Resources

Stars

Watchers

Forks

Releases

No releases published

Packages

No packages published

Languages

  • Python 100.0%