Figure number: Figure 3.39 From the IPCC Working Group I Contribution to the Sixth Assessment Report: Chapter 3
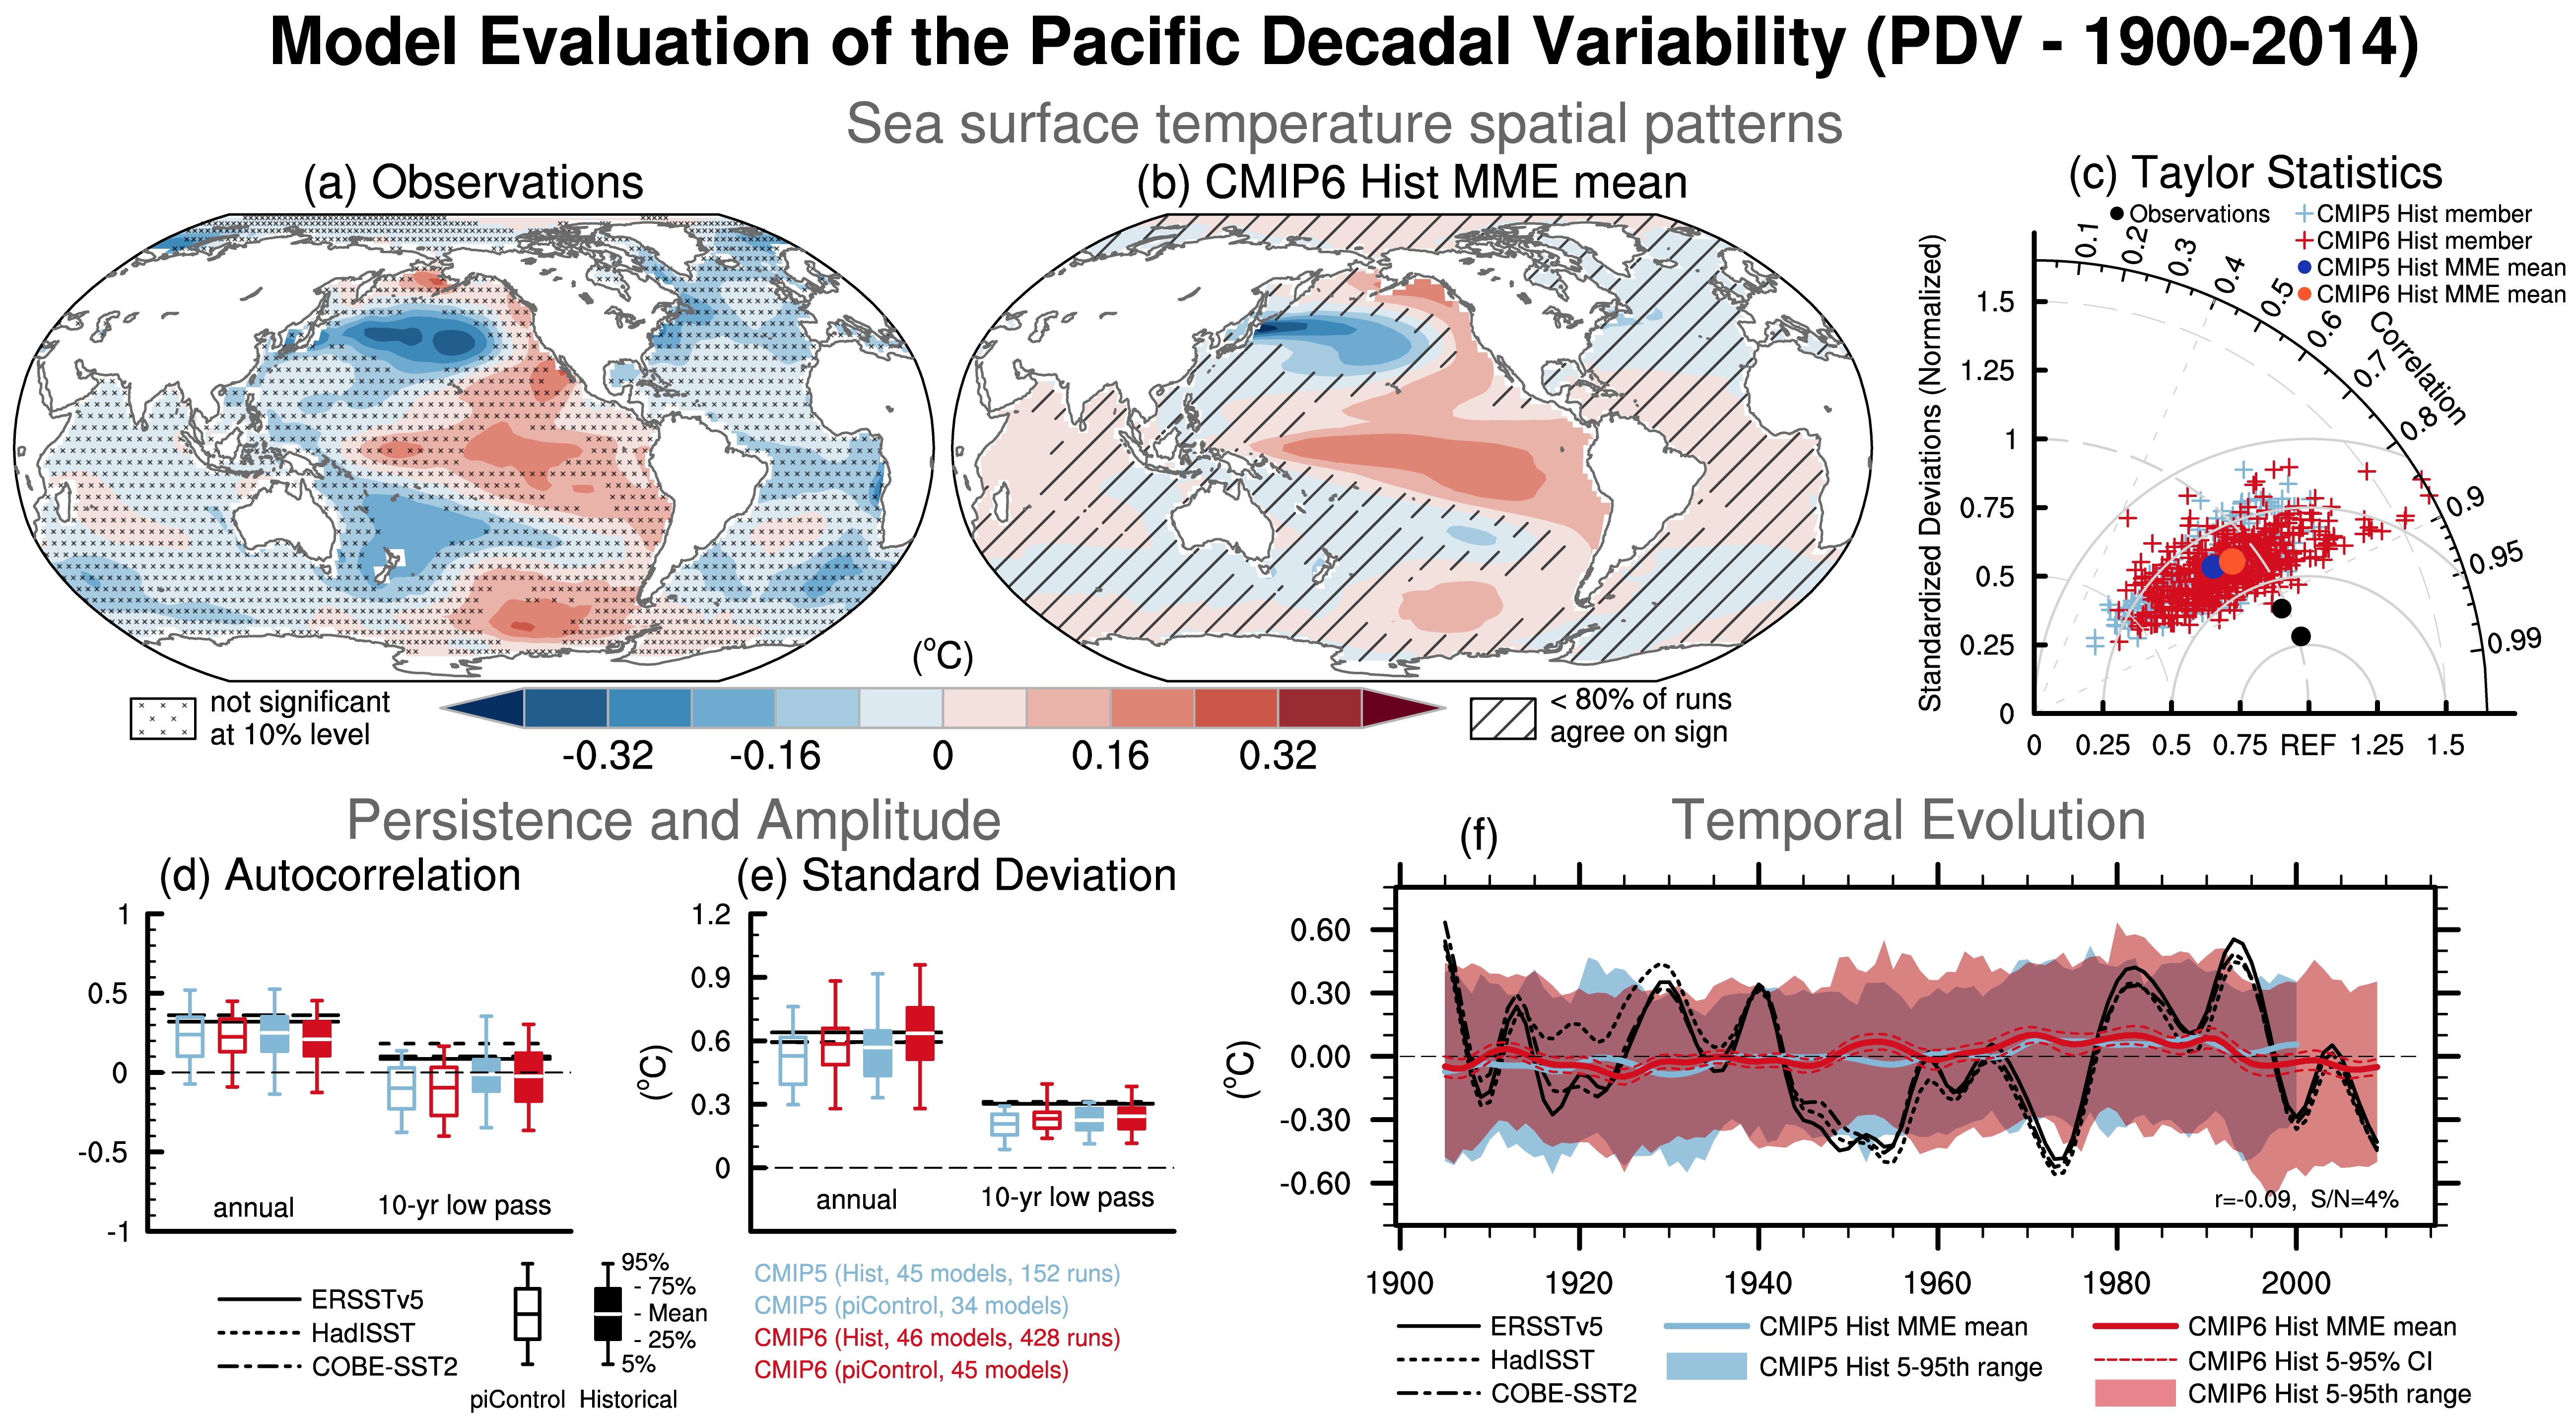
Model evaluation of the Pacific Decadal Variability (PDV). (a, b) Sea surface temperature (SST) anomalies (ºC) regressed onto the Tripole Index (TPI; Henley et al., 2015) for 1900-2014 in (a) ERSSTv5 and (b) CMIP6 multi-model ensemble (MME) composite obtained by weighting ensemble members by the inverse of the model ensemble size. A 10-year low-pass filter was applied beforehand. Cross marks in (a) represent regions where the anomalies are not significant at the 10% level based on t-test. Diagnoal lines in (b) indicate regions where less than 80% of the runs agree in sign. (c) A Taylor diagram summarizing the representation of the PDV pattern in CMIP5 (each member is shown in a cross in light blue, and the weighted multi-model mean as a dot in dark blue), CMIP6 (each member is shown as a cross in red, weighted multi- model mean as a dot in orange) and observations over [40ºS-60ºN, 110ºE-70ºW]. The reference pattern is taken from ERSSTv5 and black dots indicate other observational products (HadISSTv1 and COBE-SST2). (d) Autocorrelation of unfiltered annual TPI at lag 1 year and 10-year low-pass filtered TPI at lag 10 years for observations over 1900-2014 (horizontal lines) and 115-year chunks of pre-industrial control simulations (open boxes) and individual historical simulations over 1900-2014 (filled boxes) from CMIP5 (blue) and CMIP6 (red). (e) As in (d), but standard deviation of the unfiltered and filtered TPI (ºC). Boxes and whiskers show weighted multi-model mean, interquartile ranges and 5th and 95th percentiles. (f) Time series of the 10- year low-pass filtered TPI (ºC) in ERSSTv5, HadISSTv1 and COBE-SST2 observational estimates (black) and CMIP5 and CMIP6 historical simulations. The thick red and light blue lines are the weighted multi-model mean for the historical simulations in CMIP5 and CMIP6, respectively, and the envelopes represent the 5th-95th percentile range across ensemble members. The 5-95% confidence interval for the CMIP6 MME is given in thin dashed lines.
- Phillips, A.: NCAR, USA; asphilli@ucar.edu
- Kosaka, Y.: University of Tokyo, Japan
- Cassou, C.: CNRS-Cerfacs, France
- Karmouche, S.: University of Bremen, Germany
- Bock, L.: DLR, Germany
- Kazeroni, R.: DLR, Germany
- ESMValTool-AR6-OriginalCode-FinalFigures: ar6_chapter_3
- ESMValCore-AR6-OriginalCode-FinalFigures: fix_cmip6_models_newcore
Recipe used: recipes/ipccwg1ar6ch3/recipe_ipccwg1ar6ch3_modes.yml
Diagnostic used: diag_scripts/ipccwg1ar6ch3_modes/pdv.ncl
- recipe_ipccwg1ar6ch3_modes_YYYYMMDD_HHMMSS/plots/pdv-amv/pdv/pdv.pdf
- ESMValTool environment file: IPCC_environments/esmvaltool_ar6_yu_conda_environment.yml
- pip file: IPCC_environments/esmvaltool_ar6_yu_pip_environment.txt
Machine used: avocado.atmos.rcast.u-tokyo.ac.jp