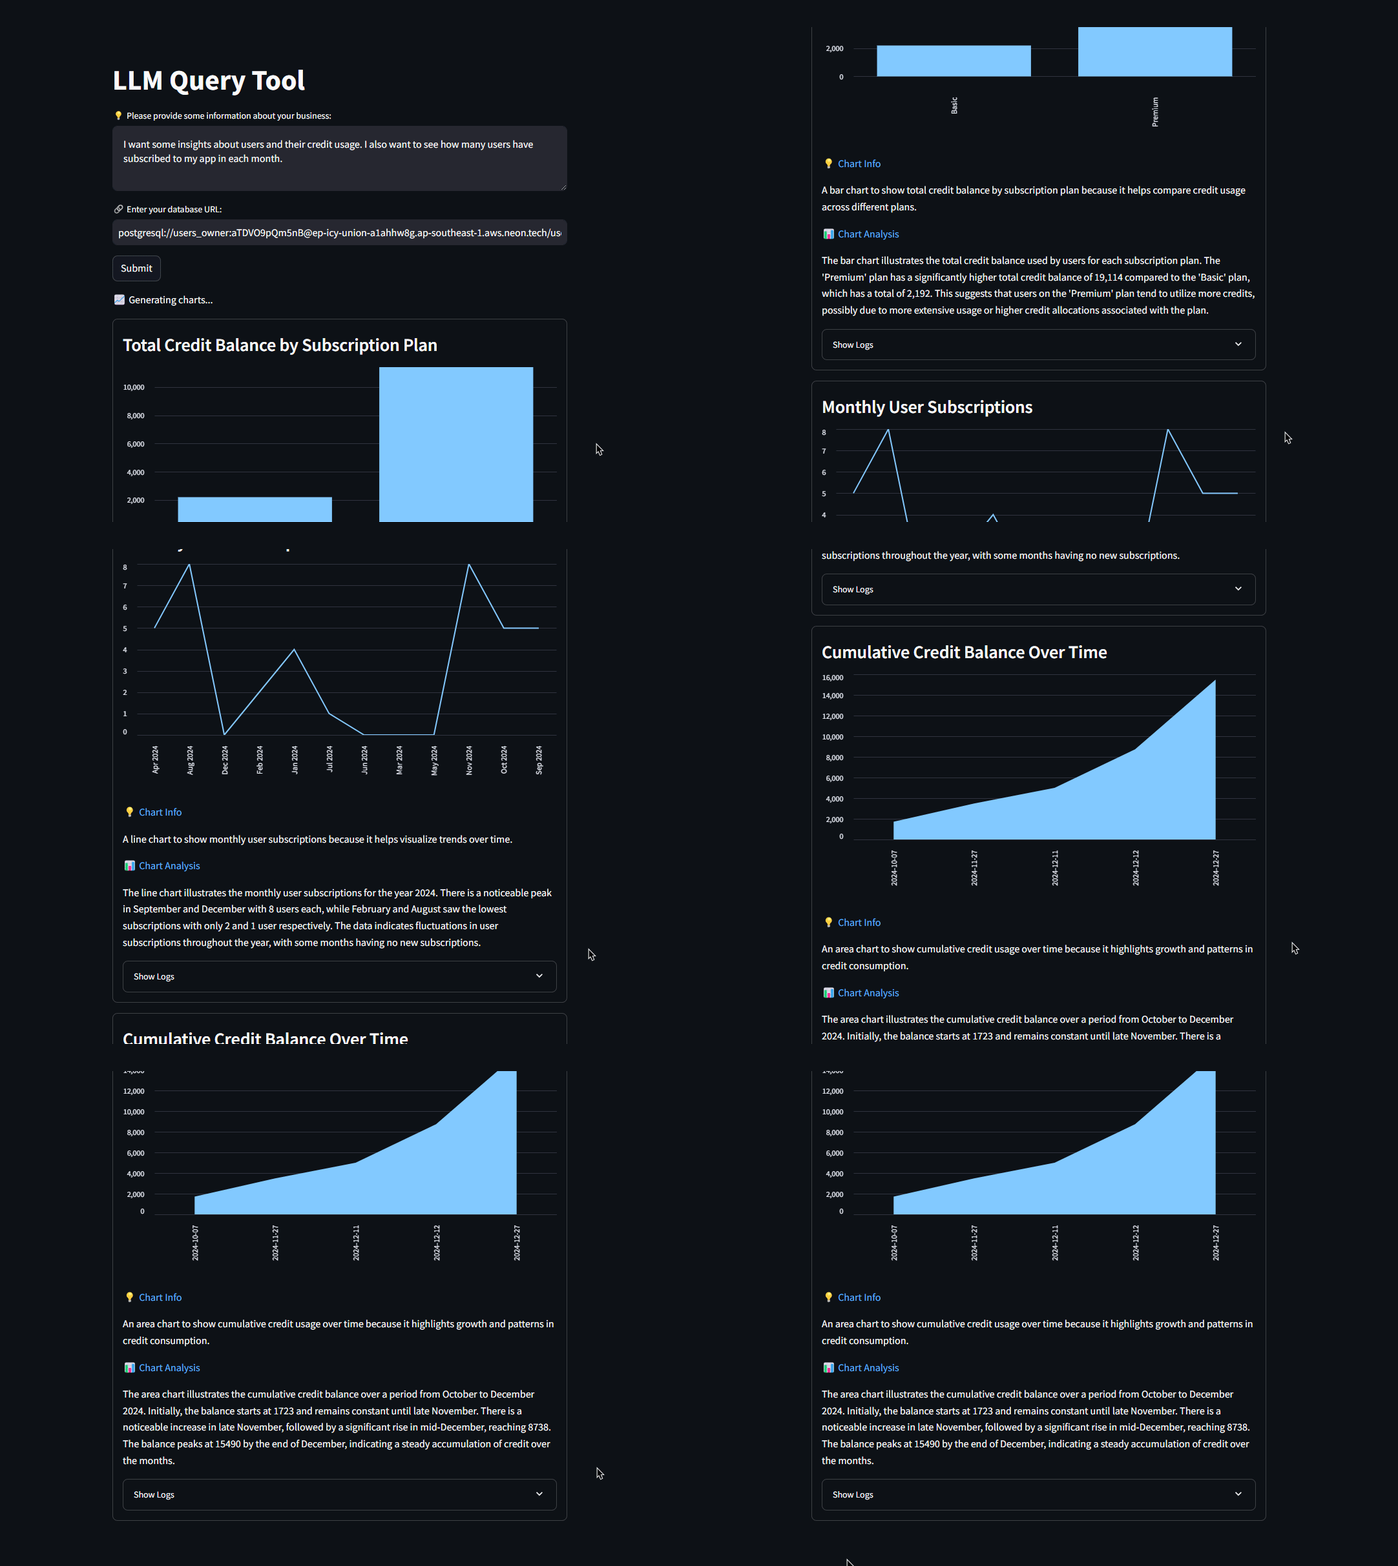
An LLM query tool to generate dynamic dashboard charts and metrics for a given business requirement and database using Large Language Models.
1. Get the business and database info from user
It will ask you about some info like your business requirements or what you want to visualize. Also you need to provide a database URL to connect with.
2. Generate chart ideas
The tool will connect with the DB and get the database information and generate 3 chart ideas based on given business requirement.
3. Generate and execute the query
For each chart idea, it will then generate a valid SQL query and execute it to get the required data
4. Format the database response and generate chart data
Chart data generater tool will then take the database response and format it in a way that it can be plotted on chart.
5. Generate charts and insights
It will then generate the given charts along with other information like chart title, chart info and insights.
Prerequisites
- Python and anaconda installed on your system
- OpenAI api key
- A database (It can be any database like MySQL, PostgreSQL, etc)
How to run?
- Clone the repository
- Create a file called
constants.pyand add your OPENAI_API_KEY in it like this
OPENAI_API_KEY = <key_here>
- Install the required dependencies
pip install sqlalchemy langchain langchain_community langchain_openai psycopg2 streamlit
- Select your existing python environment or create one using anaconda
- Run the streamlit application
streamlit run index.py

