###What? A data visualisation app for the commits in your repo, visit us here
We would like to create an app which lets you visualise the size of the changes in commit that has been made and compare the changes in the number and size of files as the project goes on.
####Why? This will be useful for project management and code reviewing. If you want to view the progression of a particular file you'll be able to see where it's been changed.
You'll also be able to see how much code was changed on it each commit.
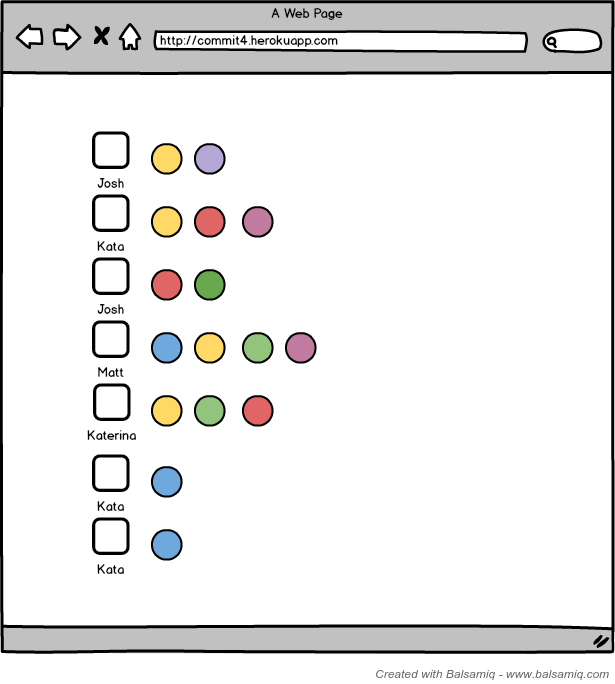
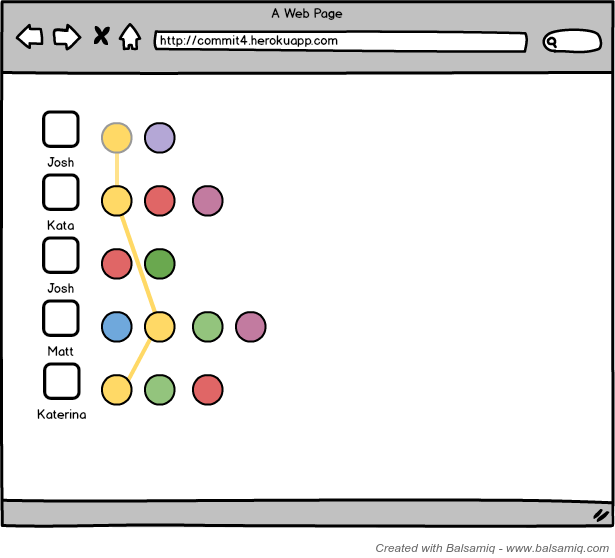
###How? Users will enter their repo name, owner name and branch. The app will make an API call to github get the commit history and display each file from a commit as a unique coloured dot. Coloured dots will be highlighted when clicked to show the thread of changes to that file. See the wireframes below for an idea of how this will look.
###Dependencies
- env2
###Dev dependencies
- codeclimate-test-reporter
- istanbul
- shot
- tape
###Running locally
If you want to run the app locally, clone the repo, run npm install to install the dependencies and then you can run the server with node server.js or if you have nodemon, nodemon server.js. Your app should be running on localhost:7777.
####Wireframes