Introduction
Wiki ▸ Introduction
Reorder.js is a JavaScript library for reordering numerical tables and graph/networks.

Visualizing data tables and graph/network can be done using a matrix visualization. Jacques Bertin, the French cartographer and visualization pioneer explained in his book "Semiology of Graphics" that, to make sense of a matrix, it should first be correctly ordered. This is what the Reorder.js library is doing.
Ordering is also useful for other purposes. For example, if you want to visualize with Parallel Coordinates, you should provide an order for the dimension axes. Reorder.js can be used to find a suitable order.
The library also provide examples of visualizations using reordering; they are based on the d3.js library.
Reorder.js works on two objects: matrix and graph. A matrix is simply a table of n rows and m columns containing numerical values. A graph is a mathematical object made of a list of vertices or nodes, and edges or links connecting them. There is an equivalence between matrices and graphs.
For the purpose of the Reorder.js library, reordering a matrix or a graph consists in computing an order, which is a permutation of all of its elements. Mathematically, a permutation is a bijection of a set into itself. In the context of this library, a permutation is just an order so, if your matrix has n rows, numbered from 0 to n-1, a permutation is a table that will map every row to a position between [0,n-1]. We represent a permutation by a list of numbers. The image at the top of this page shows a table transformed into a matrix, embellished, and reordered, to reveal interesting structures. This is done by the Bertifier program that relies on Reorder.js to manage the automated reordering.
Visualizing a graph as an adjacency matrix consists in transforming it into a matrix where every row and every column is a node, and when two nodes are connected by a link, then the cell at the intersection of the row and column contain the link as the value '1' (for non-valued links). Cells that do not correspond to actual links contain the value 0. It is also a matrix, although for undirected graphs, the matrix is symmetrical. The adjacency matrix of directed graphs is usually not symmetrical and produces a general matrix of n rows by m columns where n is the number of nodes with outgoing edges, and m is the number of nodes with incoming edges.
So, reordering a matrix consists in computing a permutation of its rows and/or columns. Reordering a graph consists in computing a permutation of its nodes.
A graph can be transformed into a matrix, and conversely a matrix can be also transformed into a graph. These dual representations are useful because there are multiple methods to compute orders for numerical matrices, and multiple methods to compute orders for graphs. With Reorder.js we can use both methods for either.
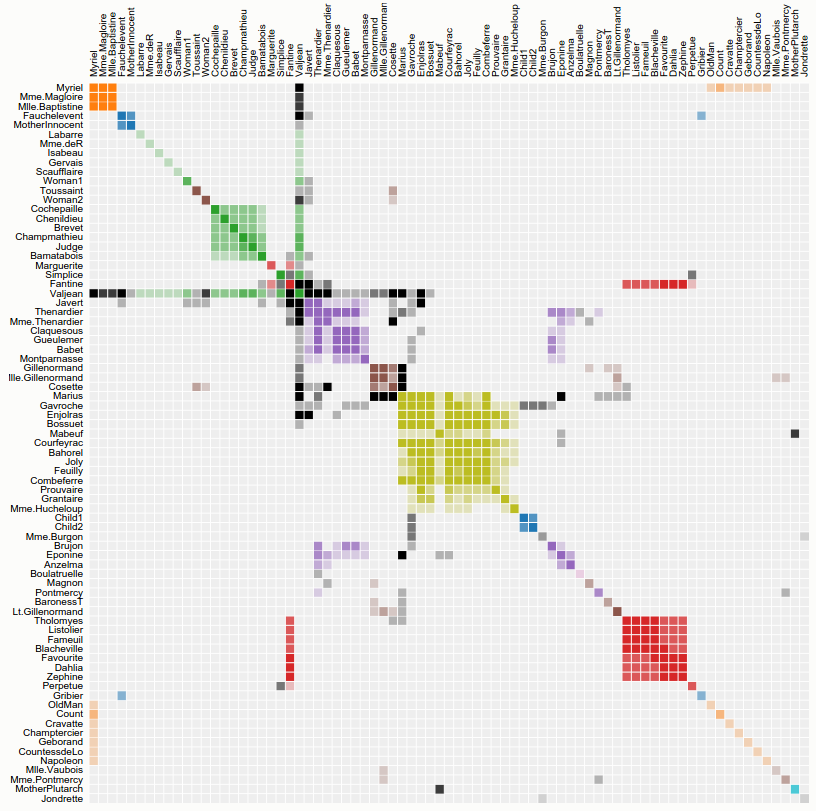
The image below shows the co-occurence matrix diagram that visualizes character co-occurrences in Victor Hugo’s Les Misérables, reordered using Reorder.js. It is included as an example in the distribution of Reorder.js.
Assuming a matrix is defined as a 2-dimensional array, reordering it consists in computing permutations for the rows and for the columns. The code below computes it for the rows and applies the permutation to get a new matrix.
var mat = [
[0, 1, 0, 1, 0],
[1, 0, 1, 0, 1],
[0, 1, 0, 1, 1],
[1, 1, 1, 0, 0]
];
var perm = reorder.leafOrder()(mat);
var permuted_mat = reorder.stablepermute(mat, perm);
The leafOrder algorithm is directly applicable to an 2-D array. Other algorithms are only applicable to a graph. If you have a graph, that's perfect. Otherwise, a matrix can be transformed into a graph:
var graph = reorder.mat2graph(mat, true);
var perms = reorder.barycenter(graph);
The barycenter algorithm is applicable to a graph. The matrix specified in the previous example can be turned into a directed graph using the mat2graph function. Note that to avoid manipulating large empty matrices when possible, the barycenter function returns a list of permutations, one per connected component. Each of them will reorder its associated connected component that can be obtained from the graph with:
var components = graph.get_components()
The Reorder.js library provides several reordering algorithms, applicable to matrices or graphs, offering various tradeoffs between quality and speed. For example, the Optimal Leaf Ordering algorithm is probably the most reliable algorithm, always providing a very good reordering, but its complexity is O(n^3) (cubic with the number of rows and columns) so it can only be used for relatively small matrices (n < 1000).
For large sparse graphs, the Barycenter heuristic is much faster, about O(E+V) with E being the number of edges and V the number of nodes. Others are faster and may provide a reasonable order in short time so it is better than no reordering at all.
Finally, the library offers mechanisms for tweaking the reordering algorithms to get more interactive control. The Bertifier system uses these mechanisms that play with the distance matrix behind the Optimal Leaf Ordering algorithm. Adding more user control is important and the Reorder.js library is designed to allow this human steering of algorithms.
Take a look at the examples under the directory examples. For example, the HTML file for the visualization of 'Les Misérables' includes the following files in index.html:
<script src="../../lib/d3.v3.js"></script>
<script src="../../lib/science.v1.js"></script>
<script src="../../lib/tiny-queue.js"></script>
<script src="../../reorder.v1.js"></script>
<script src="../matrix.js"></script>
It loads d3.js, then the science.v1.js module that contains several functions used by Reorder.js. It also loads the tiny-queue.js module used by the library reorder.v1.js. The last file contains some boilerplate code to create a matrix visualization for d3.
Allowing users to select the right algorithm interactively is done with the following HTML code:
<p>Order: <select id="order">
  <option value="name">by Name</option>
  <option value="count">by Frequency</option>
  <option value="group">by Cluster</option>
  <option value="leafOrder">by Leaf Order</option>
  <option value="leafOrderDist">by Leaf Order over Distance Matrix</option>
  <option value="barycenter">by Crossing Reduction</option>
  <option value="rcm">by Bandwidth Reduction (RCM)</option>
</select>

<p>Distance: <select id="distance">
  <option value="manhattan" selected="true">Manhattan</option>
  <option value="euclidean">Euclidean</option>
  <option value="chebyshev">Chebyshev</option>
  <option value="hamming">Hamming</option>
  <option value="jaccard">Jaccard</option>
  <option value="braycurtis">Braycurtis</option>
</select>
The visualization is created with the following code:
<script>
var margin = {top: 80, right: 0, bottom: 10, left: 80},
width = 720,
height = 720;

var x = d3.scale.ordinal().rangeBands([0, width]),
z = d3.scale.linear().domain([0, 4]).clamp(true),
c = d3.scale.category10().domain(d3.range(10));

var svg = d3.select("body").append("svg")
.attr("width", width + margin.left + margin.right)
.attr("height", height + margin.top + margin.bottom)
.style("margin-left", -margin.left + "px")
  .append("g")
.attr("transform", "translate(" + margin.left + "," + margin.top + ")");

d3.json("miserables.json", loadJson);
</script>